Dataset Identifier:
hi_otp_all_par_anom_max
Citation:
Citation Information:
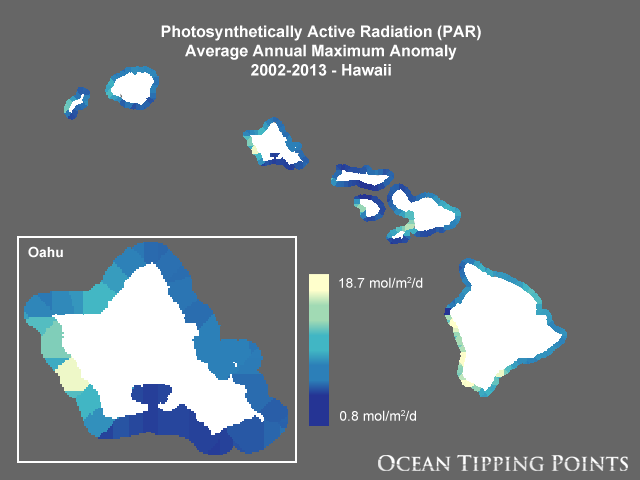
Title: Photosynthetically Active Radiation (PAR) Average Annual Maximum Anomaly, 2002-2013 - Hawaii
Originator: Carrie V. Kappel
Originator: Kimberly A. Selkoe
Originator: Ocean Tipping Points (OTP)
Publication Date: March 14, 2017
Description:
Abstract:
Solar irradiance is one of the most important factors influencing coral reefs. As the majority of their nutrients are obtained from symbiotic photosynthesizing organisms, reef-building corals need irradiance as a fundamental source of energy. Seasonally-low irradiance at high latitudes may be linked to reduced growth rates in corals and may limit reef calcification to shallower depths than that observed at lower latitudes. However, high levels of irradiance can lead to light-induced damage, production of free radicals, and in combination with increased temperatures, can exacerbate coral bleaching. This layer represents the annual average of the maximum anomaly of irradiance (mol/m2/day) from 2002 -2013. Irradiance is here represented by PAR (photosynthetically active radiation), which is the spectrum of light that is important for photosynthesis. Monthly and 8-day 4-km (0.0417-degree) spatial resolution data were obtained from the MODIS (Moderate-resolution Imaging Spectroradiometer) Aqua satellite instrument from the NASA OceanColor website (http://oceancolor.gsfc.nasa.gov).
The PAR average annual maximum anomaly was calculated by taking the average of the annual maximum PAR values in exceedance of the maximum monthly climatological PAR from 2002-2013 for each pixel. A quality control mask was applied to remove spurious data associated with shallow water, following Gove et al., 2013. Monthly climatologies were calculated from monthly time series using only full years over the Ocean Tipping Points (OTP) project time frame of interest (2002-2013). Time series of anomalies were calculated by quantifying the number and magnitude of events from the 8-day time series that exceed the maximum climatological monthly mean. Nearshore map pixels with no data were filled with values from the nearest neighboring valid offshore pixel by using a grid of points and the Near Analysis tool in ArcGIS then converting points to raster.
Purpose: This layer was developed as part of a geospatial database of key anthropogenic pressures to coastal waters of the Main Hawaiian Islands for the Ocean Tipping Points (OTP) project (http://oceantippingpoints.org). Ocean tipping points occur when shifts in human use or environmental conditions result in large, and sometimes abrupt, impacts to marine ecosystems. The ability to predict and understand ocean tipping points can enhance ecosystem management, including critical coral reef management and policies to protect ecosystem services produced by coral reefs. The goal of the Ocean Tipping Points Hawaii case study was to gather, process, and map spatial information on environmental and human-based drivers of coral reef ecosystem conditions.
Spatial Domain:
Bounding Coordinates:
West Bounding Coordinate: -160.41246°
East Bounding Coordinate: -154.56326°
North Bounding Coordinate: 22.42373°
South Bounding Coordinate: 18.75503°
Keywords:
Theme:
Theme Keyword Thesaurus: GCMD Science Keywords
Keyword: Earth Science Biosphere Aquatic Ecosystems Reef Habitat
Keyword: Earth Science Biosphere Ecosystems Marine Ecosystems Reef Coral Reef
Keyword: Earth Science Biosphere Vegetation Photosynthetically Active Radiation
Keyword: Earth Science Human Dimensions Human Settlements Coastal Areas
Keyword: Earth Science Oceans Coastal Processes Coral Reefs
Keyword: Earth Science Oceans Ocean Optics Photosynthetically Active Radiation
Place:
Place Keyword Thesaurus: GCMD Location Keywords
Place Keyword: Continent North America United States Of America Hawaii
Place Keyword: Ocean Pacific Ocean Central Pacific Ocean Hawaiian Islands
Access Constraints:
None
Use Constraints:
Use Limitation: Please contact the Ocean Tipping Points (OTP) project in advance of applying these data to project work so that the principal investigator, Carrie Kappel (kappel@nceas.ucsb.edu), can track and communicate data uses and ensure no duplicate efforts are underway. The data may be used and redistributed for free but is not intended for legal use, since it may contain inaccuracies. Neither the data Contributor, University of Hawaii, PacIOOS, NOAA, State of Hawaii nor the United States Government, nor any of their employees or contractors, makes any warranty, express or implied, including warranties of merchantability and fitness for a particular purpose, or assumes any legal liability for the accuracy, completeness, or usefulness, of this information.
Point of Contact:
Contact Information:
Contact Organization Primary:
Contact Organization: National Center for Ecological Analysis and Synthesis (NCEAS)
Contact Person: Carrie V. Kappel
Contact Electronic Mail Address: kappel@nceas.ucsb.edu
Data Set Credit:
The Ocean Tipping Points project, 2016. Please acknowledge the Ocean Tipping Points project as a source when these data are used in the preparation of reports, papers, publications, maps, and other products. When applying these data for publication, please reference and cite the following journal article: Wedding LM, Lecky J, Gove JM, Walecka HR, Donovan MK, et al. (2018) Advancing the integration of spatial data to map human and natural drivers on coral reefs. PLOS ONE 13(3): e0189792. https://doi.org/10.1371/journal.pone.0189792.
Browse Graphic:
View full image
Browse Graphic File Name: http://www.pacioos.hawaii.edu/metadata/browse/hi_otp_all_par_anom_max.png
Browse Graphic File Description:
Sample image.
Browse Graphic File Type: PNG
Back to Top
