West Maui : Honokōwai, Maui
Attention: The forecast is not accurate when a tsunami, tropical storm or cyclone watch/warning is in effect. For these events, please seek information for either tsunamis or tropical storms/hurricanes. In case of a possible inundation event, please consult with local authorities and emergency responders to seek further information and direction.

The Solid Dark Blue Curve ![]() and Solid Cyan Curve
and Solid Cyan Curve ![]() display the Past and Forecast Sea Level for the previous 3 days and the next 6 days, respectively, relative to Mean Lower Low Water (MLLW, a typical NOAA datum). Past Sea Level is obtained from a combination of a local tide model with the long-period, non-tidal sea level variability being observed in real-time at Kahului Harbor. Grey vertical lines provide the associated times of high tides.
display the Past and Forecast Sea Level for the previous 3 days and the next 6 days, respectively, relative to Mean Lower Low Water (MLLW, a typical NOAA datum). Past Sea Level is obtained from a combination of a local tide model with the long-period, non-tidal sea level variability being observed in real-time at Kahului Harbor. Grey vertical lines provide the associated times of high tides.
The Hatched Cyan Curve ![]() shows the forecast maximum height (or, run-up height) reached by waves along the shoreline in the Honokōwai region for the next 6 days, relative to MLLW. The run-up height will always exceed or equal the tide plus background sea level described above, because the waves are riding on top of that sea level. The Hatched Dark Blue Curve
shows the forecast maximum height (or, run-up height) reached by waves along the shoreline in the Honokōwai region for the next 6 days, relative to MLLW. The run-up height will always exceed or equal the tide plus background sea level described above, because the waves are riding on top of that sea level. The Hatched Dark Blue Curve ![]() shows a history of the last forecast run-up height determined for each particular time of the past 3 days; this curve provides context to show how the forecast run-up for the next 6 days differs. For more information on how the forecasts are produced, see the Details tab on the Overview Page.
shows a history of the last forecast run-up height determined for each particular time of the past 3 days; this curve provides context to show how the forecast run-up for the next 6 days differs. For more information on how the forecasts are produced, see the Details tab on the Overview Page.
If the forecast run-up extends into the red shaded region on the plot, the waves are expected to at least become a disruption for beach activities. The higher the forecast the more severe the expected effects. One or more of the following threshold levels is/are shown in the red shaded area in the plot above: (a) Light Impacts, (b) Hazardous Impacts, (c) Critical Impacts. Click on the Run-up Examples tab for descriptions of the possible hazards.
Notifications
If you would like to receive notifications when the forecast for Honokōwai (or any other West Maui region) reaches the impact stage, please register here:

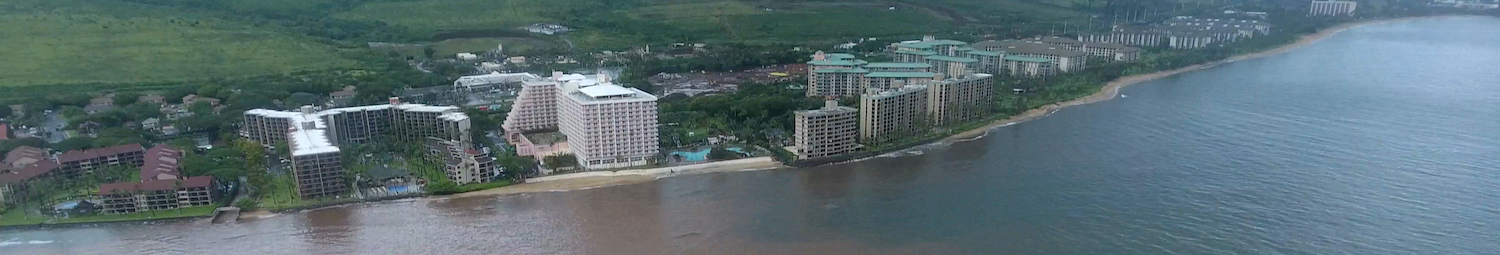
The Honokōwai region reaches from Olali St. in the north (just south of “S-turns” surf break) to Honoapiʻilani Park in the south (just north of Honua Kai Resort). The region is densely developed, including many multi-story resorts and condominiums very close to the shoreline. Most of the shoreline is backed by shoreline hardening structures and is without beach, except for some minimal intermittent (seasonal) sand accumulation. Many of the shoreline hardening structures have been subject to failure in the last decade due to the impacts of high waves and erosion. The shoreline is moderately protected from waves by a narrow fringing reef and a beach rock ridge along much of the shoreline. As aging shoreline hardening structures begin to fail, buildings and infrastructure are threatened by impacts from high waves and erosion.
Run-up Thresholds
(a) Light Impact – beach and nearshore activities disrupted as occasional waves sweep the beach slopes, or intermittently reach shoreline hardening structures, infrastructure or occasional vegetation.
(b) Hazardous Impact – heavy wave action on beaches; battering of shoreline hardening structures; likely run-up onto the few parts of the coast that are not artificially protected by shoreline hardening structures; and/or erosion of unprotected shoreline.
(c) Critical Impact – strong battering of shoreline hardening structures; waves regularly overtopping shoreline hardening structures; flooding of adjacent land and buildings; and/or significant erosion of unprotected shoreline.
Run-up Examples
(b) Hazardous Impact Event — June 22-23, 2017 | Honokōwai Point

Photo Credit: Don McLeish (Hawaiʻi and Pacific Islands King Tides Project).

Photo Credit: Don McLeish (Hawaiʻi and Pacific Islands King Tides Project).

(b) Hazardous Impact Event — June 14, 2018 | Honokōwai Point

Photo Credit: Tara Owens (Hawaiʻi and Pacific Islands King Tides Project).

(b) Hazardous Impact Event — August 10, 2018 | Honokōwai Point

Photo Credit: Don McLeish.

Photo Credit: Don McLeish.

(b) Hazardous Impact Event — July 3, 2020 | Honokōwai Point

Photo Credit: Don McLeish (Hawaiʻi and Pacific Islands King Tides Project).

Photo Credit: Don McLeish (Hawaiʻi and Pacific Islands King Tides Project).

Photo Credit: Don McLeish (Hawaiʻi and Pacific Islands King Tides Project).

Photo Credit: Don McLeish (Hawaiʻi and Pacific Islands King Tides Project).

(c) Critical Impact Event — July 11, 2016 | Honokōwai Point and Kaʻanapali Beach Club

Photo Credit: Don McLeish.

Photo Credit: Don McLeish.

Photo Credit: Don McLeish.

Photo Credit: Don McLeish.

Photo Credit: Tara Owens.

Get Involved!
We continue to collect photo documentation to fine-tune the model (if necessary) and to identify the impacts of these run-up events along the West Maui shoreline. We are specifically interested in photos around peak tides or swells, or anytime waves overtop beach features. If possible, capture the maximum extent of water running up the shoreline. The contributions from you, our citizen scientists, greatly contribute to establishing accurate thresholds for the model. Mahalo for your support!
Please submit your photos at:
To view photo submissions, please check out:
An archive of previous forecast plots can be accessed below. Select a day of interest from the calendar, or use the slider tool to quickly navigate through all available images. Two historical forecast plots are provided for each day, generated at 6:00 AM and 6:00 PM of the local time zone. To view the most recent forecast and to learn more about the different components of the graph, please go to the Forecast tab.
date: :
Loading archive...