Sea Level Rise : American Samoa Sea Level Rise Viewer
An Interactive Mapping Tool to Assess Future Sea Level Rise Scenarios
 |
, University of Hawaii at Manoa (UH)") |
NOTE: This interactive mapping application is ill-suited for small screen sizes. Below is a screenshot only. Please visit again from a laptop or desktop computer to enable the application or make your browser window bigger.

|
||
|
DISCLAIMER: This tool provides a scientific prediction of potential future conditions from flooding due to sea level rise. The methodology is based on published, peer-reviewed techniques. However, as with any forecast, accuracy cannot be guaranteed and actual impacts may vary from these predictions. While considerable effort has been made to implement all components in a thorough, correct, and accurate manner, errors are still possible. The results are provided without warranty of any kind. The risks associated with use or non-use of the results are assumed by the user.
Sea level rise projections are island-dependent: Tutuila, Aunuʻu, and the Manuʻa Islands (Ofu, Olosega, and Taʻū) include vertical land motion in their sea level rise projections while Swains Island and Rose Atoll do not. The digital elevation model (DEM) was adjusted from NAD83 (PA11) to 2005 as it is the common interval across datasets. However, the adjustment of the DEM may lead to inaccuracies due to the lack of historic information.
SUGGESTED CITATION: Baizeau, C., K. Anderson Tagarino, J.E. Stopa, and P.R. Thompson. 2023, updated 2025. American Samoa Sea Level Rise Viewer. Version 3.00. Prepared by the Pacific Islands Ocean Observing System (PacIOOS) for the University of Hawaiʻi Sea Level Center (UHSLC) with funding from the Pacific Islands Climate Adaptation Science Center (PI-CASC). http://pacioos.org/shoreline/slr-amsam/. Accessed [date].
NOTE: Additionally, please cite any data sources used and related publications as suggested in the dataset descriptions further below.
If you have questions or comments about the resources and information contained on these pages, please contact Carla Baizeau and Kelley Anderson Tagarino.
1. Overview
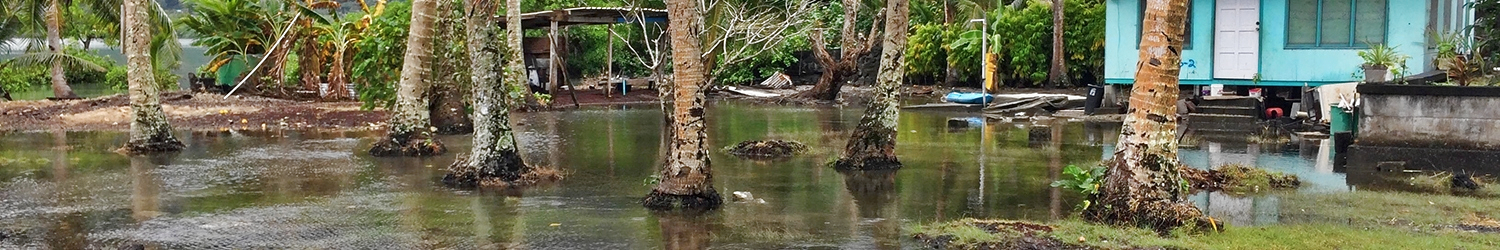
Since the earthquake doublet that generated the devastating Samoan tsunami in September 2009, American Samoa continues to experience accelerated rates of sea level rise (SLR) due to land subsidence, or sinking of land. The American Samoa Sea Level Rise Viewer (Viewer) is an interactive tool developed to allow stakeholders to assess local vulnerability to sea level rise. The Viewer provides maps of flooding extent for various combinations of:
- Sea level rise scenario with the ability to select specific future years (Sections 3.1–3.2).
- One-foot increments of sea level rise (Section 3.3).
- Frequency of flooding (Section 5).
Maps are shown at mean higher high water (MHHW) relative to 2005. This page provides a brief overview of sea level rise, the development of this tool, and the types of information presented. For more information, please use the links provided below.
The project was developed by the Pacific Islands Ocean Observing System (PacIOOS) at the University of Hawaiʻi at Mānoa (UH) School of Ocean and Earth Science and Technology (SOEST) and the Department of Oceanography at UH SOEST in partnership with the University of Hawaiʻi Sea Grant College Program, also within UH SOEST. The Viewer was funded by the Pacific Islands Climate Adaptation Science Center (PI-CASC).
See also:
To report impacts of sea level rise or other hazards in American Samoa, check out the Tautua hazards reporting tool: https://tautua.as. Tautua is an independent website not affiliated with PacIOOS or this Viewer.
2. Past and Current Sea Level Rise
Global mean sea level (GMSL) is rising due to warming of the Earth’s climate. Thermal expansion and addition of water due to melting ice are mainly responsible for GMSL rise. They also drive local sea level rise, which is additionally influenced by regional processes such as vertical land motion and local climate phenomena.
As global temperature rises, the ocean holds a larger volume (because warmer water takes up more space), leading to an increase in sea level. Water on land is stored as ice in ice sheets (i.e., Greenland or Antarctica) or glaciers, and the water enters the ocean when the ice melts, causing rising sea levels. (For more information on global sea level rise, see NASA – Understanding Sea Level.) Along with the spatial variations related to thermal expansion and on-land ice melting, local processes affect local sea level, such as vertical land motion (VLM). The earth can move vertically for a number of reasons, including tectonic events, and this vertical movement can last for decades.
In the case of the Samoan tsunami-earthquake, the land has been sinking at an increased rate in American Samoa since the earthquake doublet event in 2009, leading to accelerated rates of SLR, which are further discussed below. Volcanic islands normally begin to subside after reaching their peak elevation. However, for the Samoan Islands, the subsidence rate increased dramatically after the 2009 earthquake doublet due to “post-seismic subsidence”, or subsidence after an earthquake. Post-seismic land subsidence is a function of distance from the earthquake epicenter. Tutuila and Aunuʻu are the most impacted islands of American Samoa as they are closest to the earthquake epicenter. Land subsidence rates in the Manuʻa Islands (Ofu, Olosega, and Taʻū) are assumed to be similar to rates in Tutuila and Aunuʻu. However, it is unknown how Swains Island and Rose Atoll are impacted by vertical land motion due to their distance from the earthquake epicenter. (For more information on local sea level rise, see NASA – Regional Relative Sea-Level Change.)
Over the 1993-2023 period using the satellite record that measures absolute SLR, GMSL is rising at a rate of 3.56 mm/yr compared to 4.49 mm/yr in American Samoa (Figure 1, black line). From 2013 to 2023, these rates increased to 4.42 mm/yr and 12.18 mm/yr, respectively. The former indicates global trends due to climate change while the latter also represents local processes such as La Niña conditions in American Samoa. Satellites record absolute sea level, meaning sea level change due to processes occurring in the ocean only. Therefore, sea level measurements from space can overestimate or underestimate sea level compared to on-land measurements (tide gauges), because satellites do not capture the effect of land motion. This is the case in American Samoa.
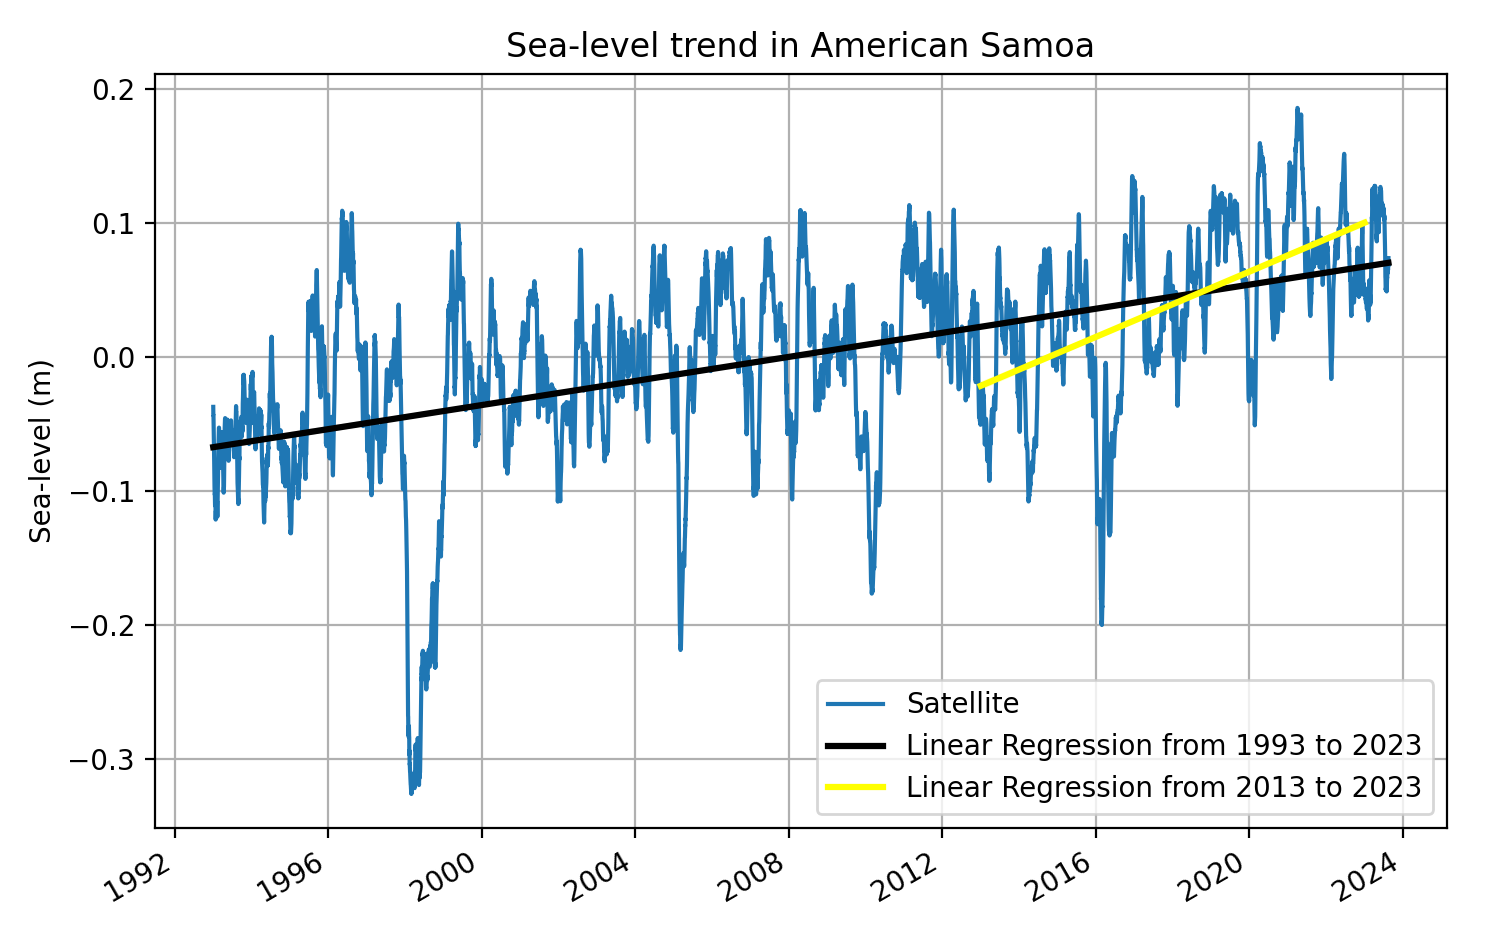
Figure 1. Satellite record for Pago Pago, American Samoa, leveled at mean sea level of 0 m (MSL=0) in 2005 (from Copernicus Marine Service). Sea level is rising at a linear rate of 4.49 mm/yr from 1993 to 2023 (black) and 12.18 mm/yr from 2013 to 2023 (yellow).
“Relative” sea level refers to the combined effect of subsidence (sinking of land) and the rising of ocean levels caused by global sea level rise. For example, if Tutuila is subsiding (sinking) at 10 mm/yr and sea level is rising at 4 mm/yr, then the relative SLR rate per year is 14 mm/yr. Since 2009, the satellite and tide gauge (Caldwell et al., 2001) records are diverging (Figure 2). As shown in Figure 2, the satellite measurements indicate lower rates of SLR since the end of 2009 compared to the tide gauge record, leading to higher SLR in 2023. Using GPS data from the American Samoa Power Authority (ASPA) National Geodetic Survey (NGS) Continuously Operating Reference Station (CORS) (Blewitt et al., 2018), we were able to attribute this gap to land subsidence, confirming a relationship with the 2009 earthquake (Han et al., 2019). Indeed, in Figure 2, the blue line (satellite minus GPS) shows the combination of the GPS data (land subsidence) and the satellite data, which fits the tide gauge trend. From 2013 to 2023, relative sea level has been rising at an average rate of 16.72 mm/yr (including land subsidence, compared to 12.18 mm/yr excluding land subsidence, as mentioned before). Since the earthquake, the land has sunk by approximately 19.56 cm while the total sea level has risen by approximately 22.28 cm.
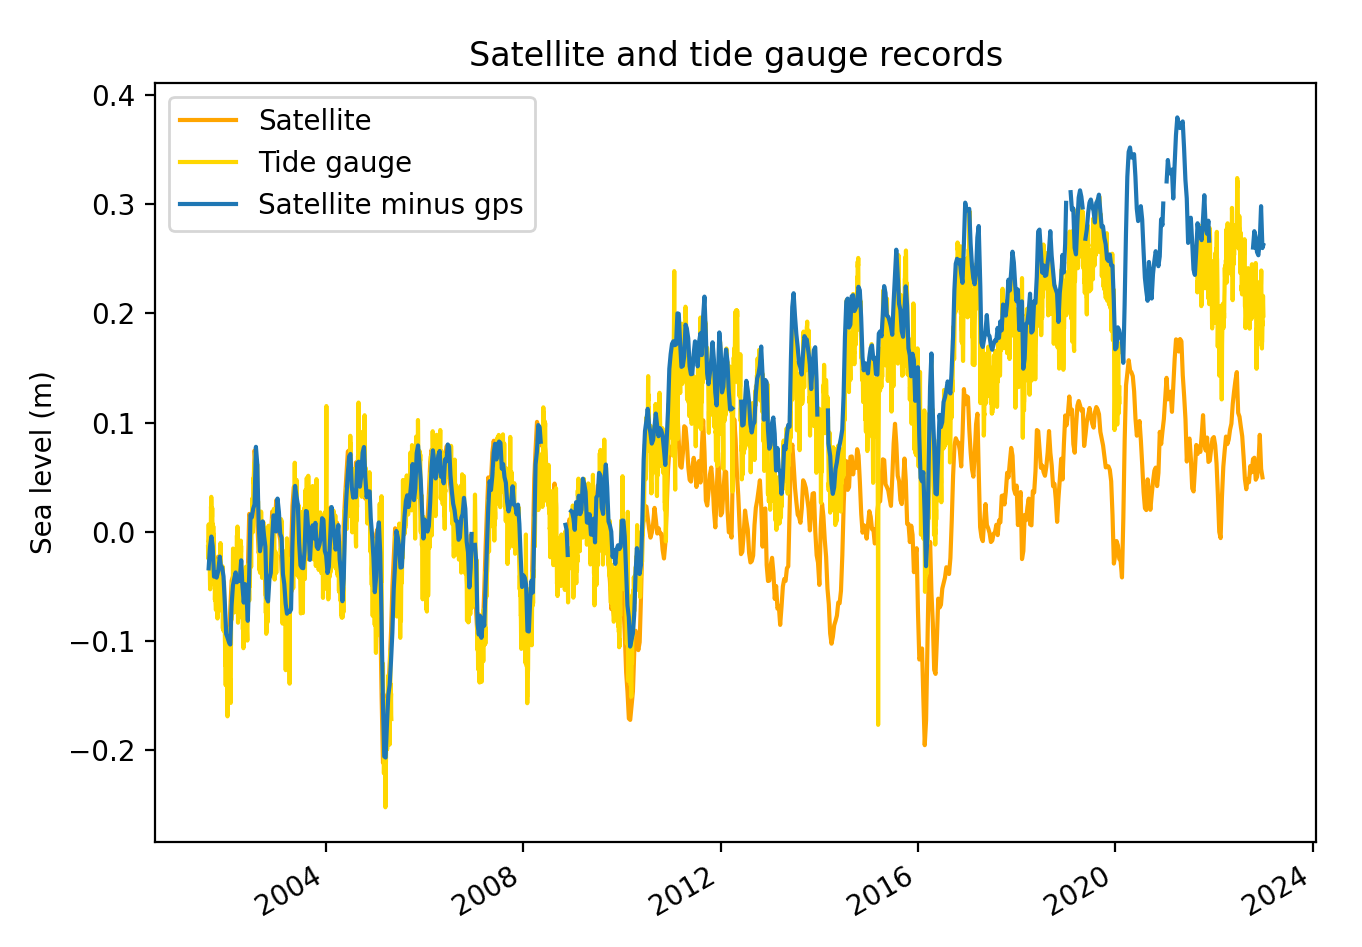
Figure 2. Satellite (orange), tide gauge (yellow), and satellite minus GPS (blue) records from 2001 to 2023. Mean sea level of 0 m (MSL=0) in 2005 for all datasets. All records are processed using a 10-day rolling mean. The difference between the satellite (orange) and tide gauge (yellow) records since 2009 is attributed to land subsidence, confirmed by satellite minus GPS (blue).
3. Future Sea Level Rise
3.1. Sea Level Rise Scenarios
The Intergovernmental Panel on Climate Change (IPCC) developed a framework to project future climate and sea level. These projections are accepted as the best available science on sea level rise and are the basis for the sea level rise scenarios in this Viewer. The IPCC divides possible societies into several groups, referred to as the shared socio-economic pathways (SSPs). These are based on indicators such as education, population growth, and gross domestic product (GDP) and range from a very sustainable, low-emission world to a higher-emissions future. The IPCC uses these SSPs to make projections of greenhouse gas emissions (Representative Concentration Pathways, or RCPs), which are then used in computer models of the atmosphere and ocean to project the climate in the future depending on how society evolves. Output from the models can then be translated into sea level rise projections based on the science of how the ocean warms and ice melts in response to changes in climate. The purpose of IPCC projections is to improve scientific understanding and are therefore presented as ranges of future possibilities, with a different range for each SSP.
Due to the complexity of interpreting the SSPs and various ranges of possibilities from the IPCC, a United States Interagency Task Force (ITF)—composed of scientists from NASA, NOAA, USGS, and others—developed a set of scenarios for planning purposes based on the IPCC projections. Since the goal of the American Samoa Sea Level Rise Viewer is to support coastal planning, we use the ITF projections for this tool. However, land subsidence in American Samoa is unique and not well represented in the existing ITF scenarios for American Samoa. Han et al. published in April of 2019 a set of land subsidence projections that more accurately represent the current trends. However, as mentioned earlier (Section 2), islands are impacted by land subsidence differently. Therefore, in order to construct more realistic projections for American Samoa, we combined the climate-related contributions to SLR from the ITF projections (Sweet et al., 2022) with the land subsidence from Han et al. (2019) only for Tutuila, Aunuʻu, and Manuʻa Islands (Ofu, Olosega, and Taʻū). In contrast, SLR projections for Swains Island and Rose Atoll only include the climate-related processes (ITF).
Table 1 below shows the differences in relative SLR projections between the ITF projections and the projections with the updated land subsidence. All are relative to 2005. The final projections used for Tutuila, Aunuʻu, and Manuʻa are shown in Figure 3.
Table 1. SLR projections for the intermediate scenario from the U.S. Interagency Task Force (ITF) (first column), Han et al. 2019 (second column, ITF + land subsidence from Han), percentage of ITF underestimation compared to Han (third column), and SLR height difference between Han and ITF (fourth column). Projections are relative to 2005.
units:
| Year | Projections (cm) | Percentage (%) | Difference (cm) | |
|---|---|---|---|---|
| ITF | Han | ITF / Han | Han − ITF | |
| 2030 | 15 | 34 | 56 | 19 |
| 2040 | 22 | 44 | 50 | 22 |
| 2050 | 32 | 54 | 41 | 22 |
| 2060 | 42 | 65 | 35 | 23 |
| 2070 | 56 | 77 | 27 | 21 |
| 2080 | 72 | 92 | 22 | 20 |
| 2090 | 93 | 112 | 17 | 19 |
| 2100 | 118 | 136 | 13 | 18 |
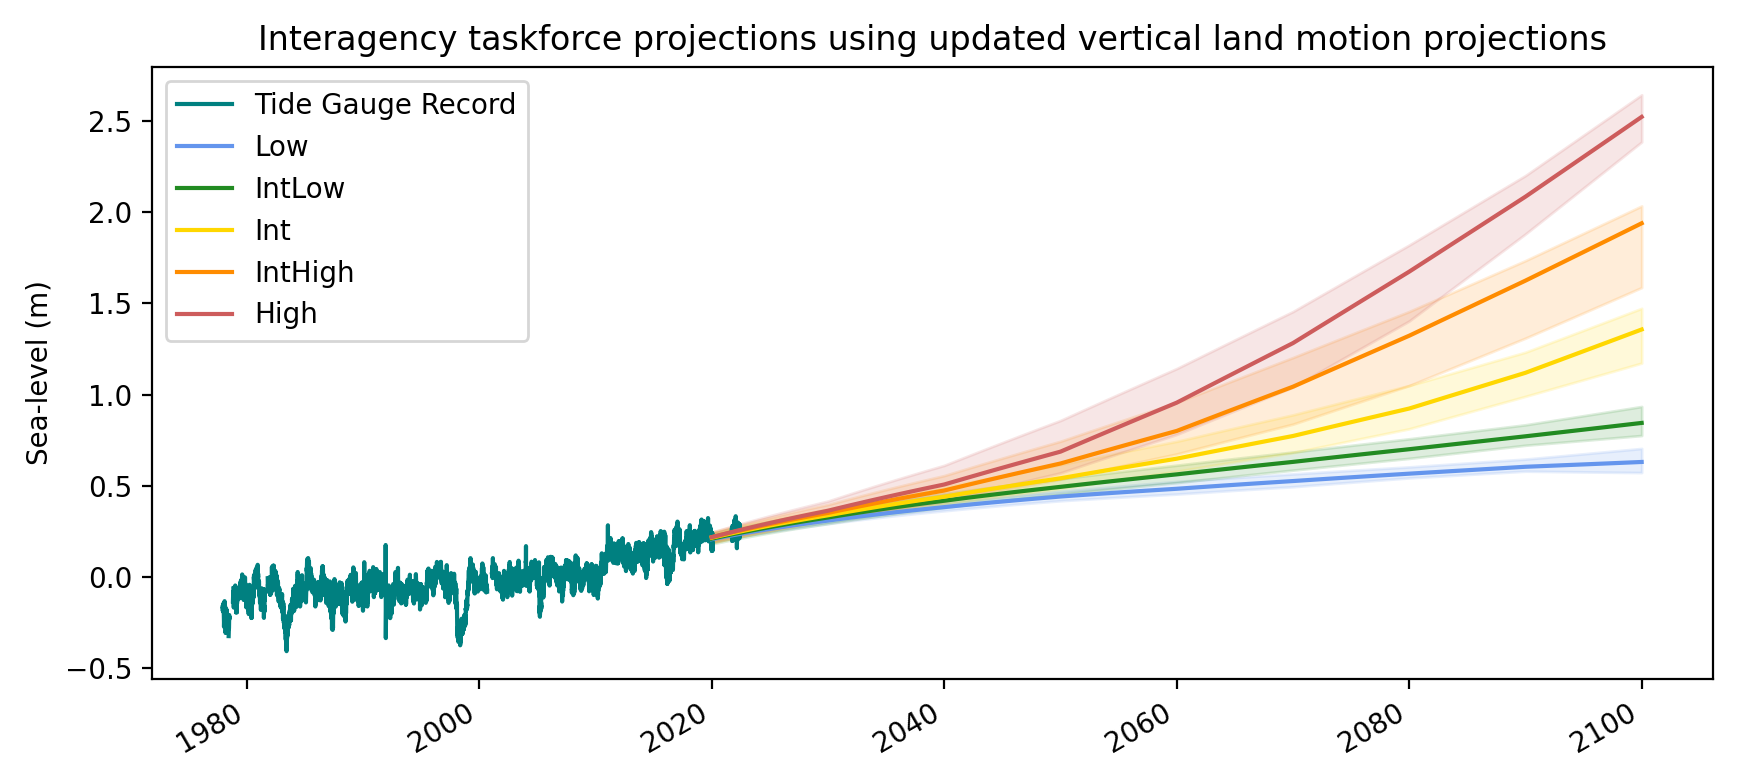
Figure 3. SLR projections at Pago Pago, American Samoa, using U.S. Interagency Task Force (ITF) projections and Han et al. 2019 land subsidence projections. Tide gauge record (teal), scenarios from Low (blue) to High (red) until 2100. Projections are relative to 2005.
3.2. How to Use the Scenarios
A brief description for each scenario and how to use them follows:
- Low: Significant world-wide emissions reductions are implemented now, which is highly unlikely. It is not recommended to use this scenario for planning purposes.
- Intermediate Low: World-wide society limits increase of emissions, and sea level rises without reaching any tipping points, i.e. large and sudden changes such as a rapid increase in ice sheets melting. It is recommended to use this scenario only for planning construction of non-critical infrastructure that owners can afford to lose, such as a beach fale.
- Intermediate: World-wide society continues current emissions rates, and sea level rises at increased rates compared to the intermediate low scenario. Tipping points, i.e. large and sudden changes, are still not crossed. It is recommended using this scenario for planning construction of infrastructure with low-to-medium critical use and lifespans extending into the second half of the century, such as a new storefront.
- Intermediate High: World-wide society continues to increase emissions rates. Tipping points, i.e. large and sudden changes, are triggered; ice loss increases rapidly but is not catastrophic. It is recommended using this scenario for planning construction of infrastructure with medium-to-high critical use and longer lifespans, such as a new government office.
- High: World-wide society continues to increase emissions. Tipping points (large and sudden changes) are triggered, and worst-case possibilities arise. It is recommended using this scenario for planning construction of infrastructure with highly critical use and longer lifespans, such as a new hospital.
3.3. Increments of Sea Level Rise
As an alternative to the SLR scenarios, the Viewer provides the ability to select specific amounts of SLR in increments of one foot, independent of any particular scenario. This information can be used if guidance for a project requires planning for a specific amount of SLR rather than a time horizon.
4. Passive Flooding Model
The American Samoa Sea Level Rise Viewer uses passive flood modeling, also called “bathtub” modeling, to estimate the extent and depth of areas vulnerable to flooding for a given amount of SLR. The modeling approach follows the method by Cooper and Chen (2013), as well as the method developed by NOAA (“Detailed Method for Mapping Sea Level Rise Inundation”, 2017). Passive flooding can be thought of as adding water to a tub over the shape of the land and does not include waves, wind, and other factors that exist in the ocean, which is why it underestimates the extent and depth of impacts from sea level rise. However, it requires simple datasets and is computationally efficient (short processing times despite the large area covered) (Anderson et al., 2018). This modeling approach is computed by raising the water level uniformly onto a digital elevation model (DEM) according to the projected water levels. Low-lying areas not connected to the shore (not connected hydrologically) remain flooded using this approach because they are assumed to be connected to the groundwater water table (see Figure 4), leading to what is known as groundwater flooding. As sea level rises, saltwater intrudes into the aquifer and causes the water table to rise above the land surface.
It is essential to emphasize that the passive flooding model used in the Viewer does not include the effects of waves on flooding. As a result, the extent and impacts of future flooding under high-wave conditions are not represented, which should be accounted for in planning efforts. Research on wave inundation is planned, and future versions of this tool will include the contribution of waves to flooding extent. In addition, the DEM is assumed to be unchanged as sea level rises, but in fact there will be erosion and changes in the shape of the land surface, and continued subsidence. This also must be considered, and it is best practice to consider any flooding extent or depth in the Viewer as a best-case scenario, with the effects of dynamic shoreline processes leading to greater flood extent and depth than presented.
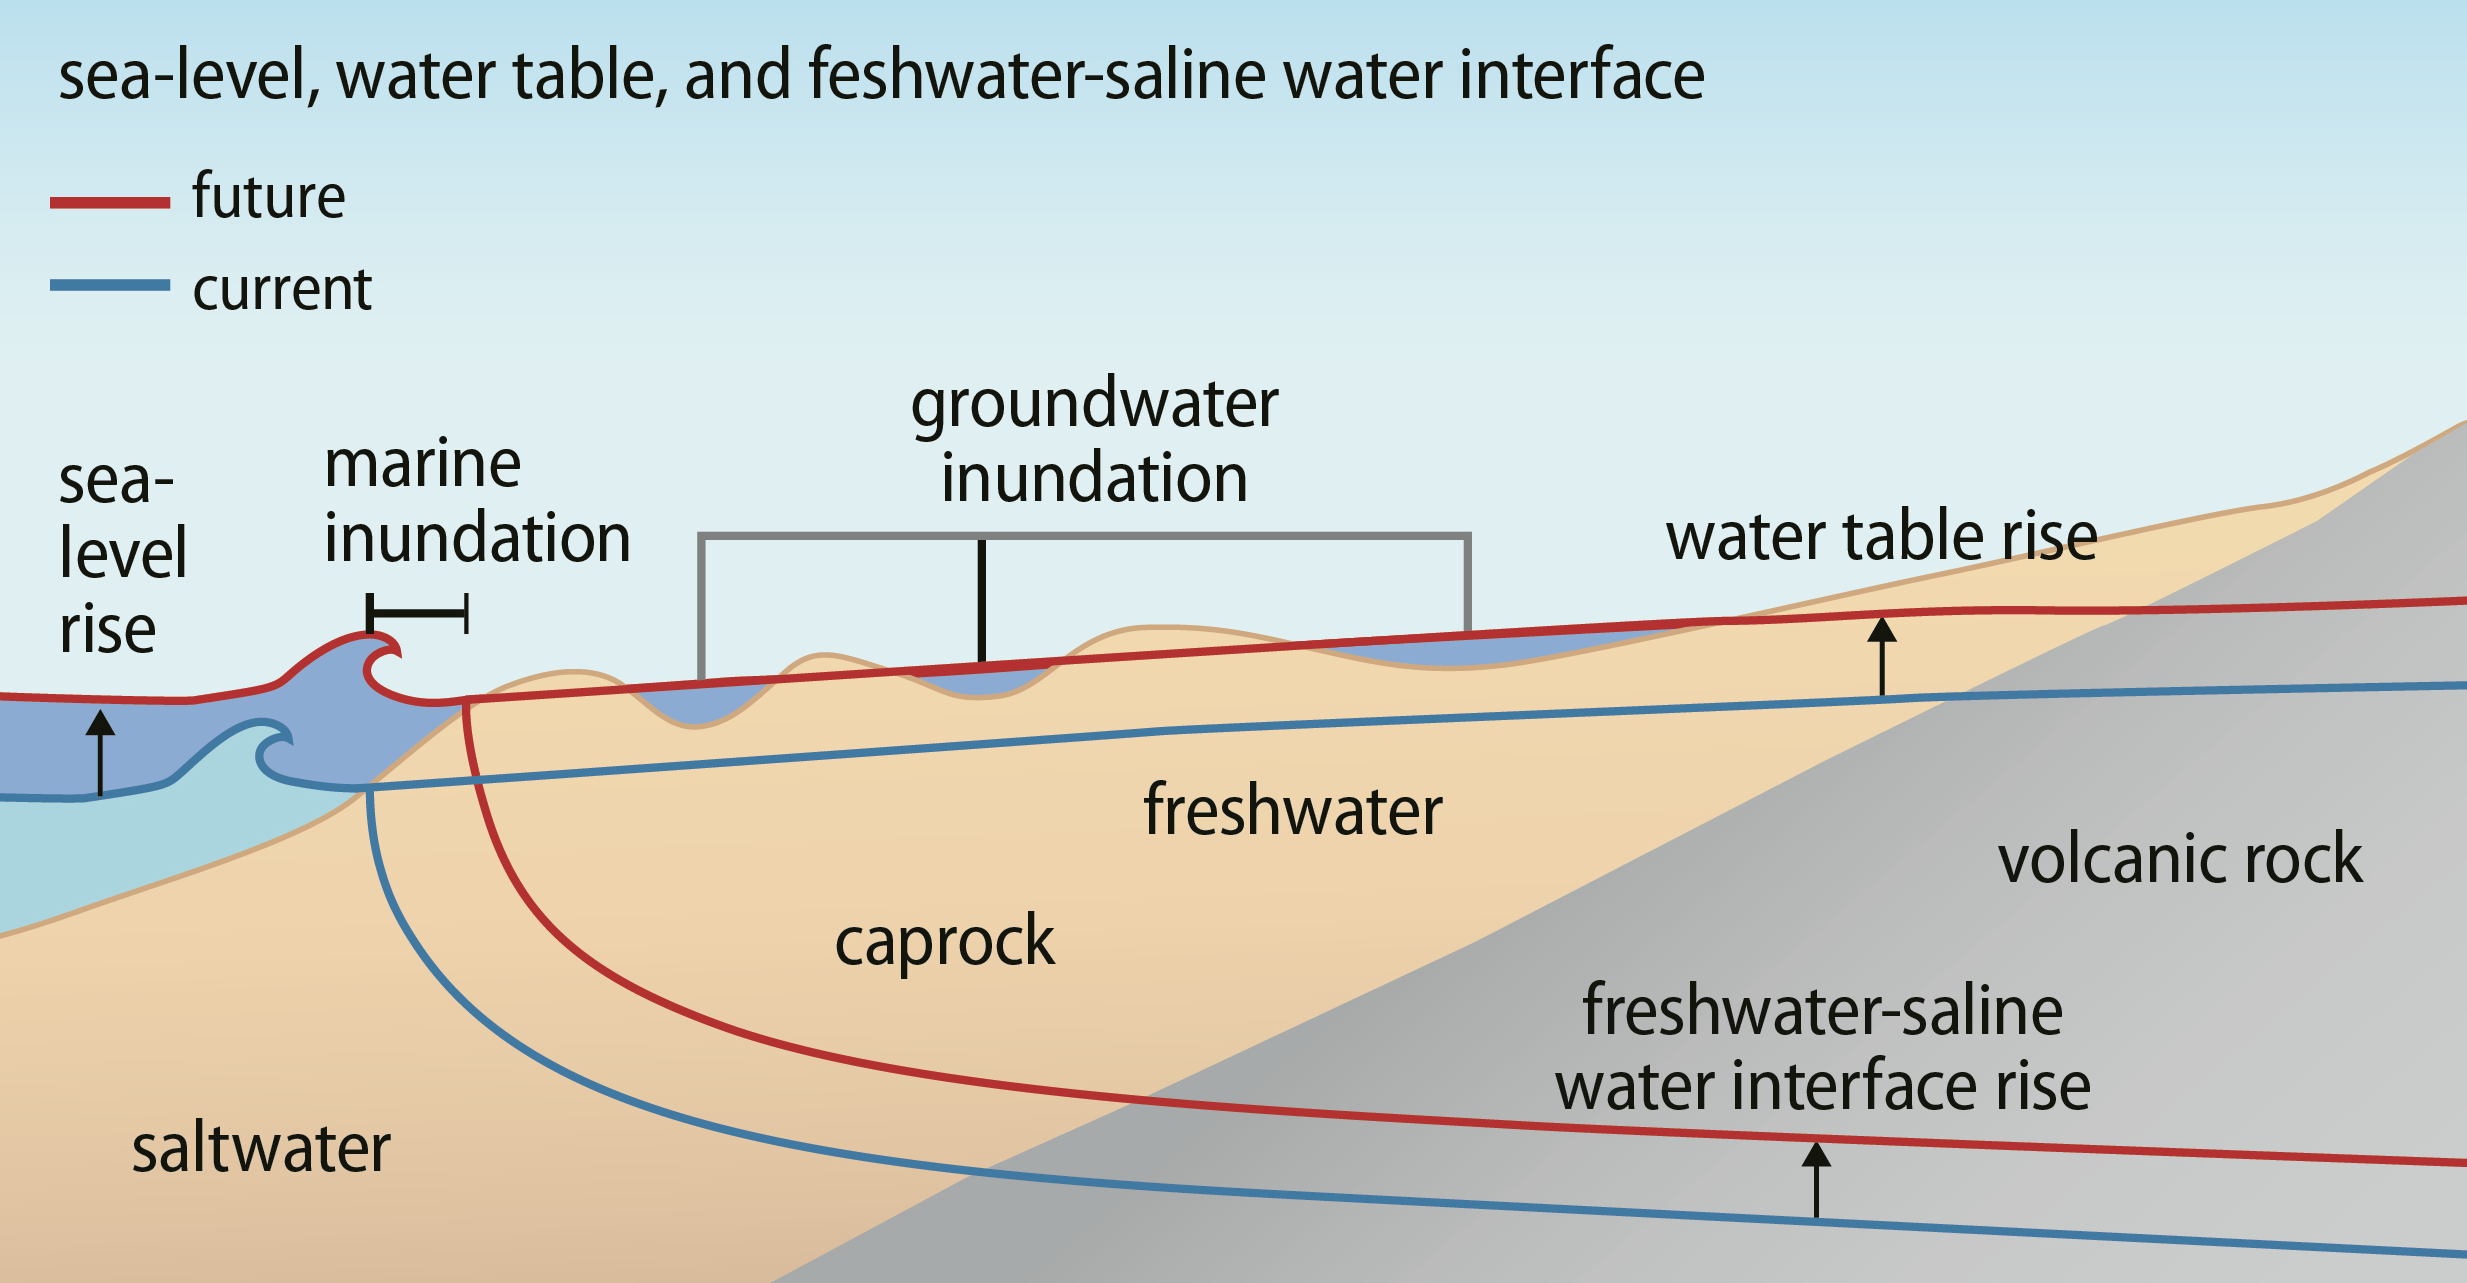
Figure 4. Schematic diagram showing groundwater flooding as sea level rises from current sea level (blue) to future sea level (red) (from the State of Hawaiʻi Sea Level Rise Viewer; adapted from Rotzoll and Fletcher 2012).
We apply this model to the 2022 lidar DEM (National Geodetic Survey, 2022) with 1-meter resolution, relative to 2005. It is important to acknowledge that any inaccuracies in the DEM will lead to inaccuracies in the flooding estimates.
5. Frequency of Flooding
When assessing the impacts of future sea level rise, it is important to consider how often flood conditions will occur in a given year. A low-lying location will begin to see impacts of being flooded a few times per year. Then, as sea level rise increases, it will flood tens of times per year. Eventually, that location may be flooded under a daily high tide. The American Samoa Sea Level Rise Viewer allows for the selection of various numbers of flood days per year to span these possibilities.
One of the options presented in the viewer is Mean Higher High Water (MHHW), which is the average height of the highest tide of the day. Selecting this option tracks the upper extent of the intertidal zone, which is the zone between low tide and high tide. As the intertidal zone shifts landward with SLR, the shaded region in the maps indicates areas that can no longer be considered “dry land”.
The remaining options for “flood days per year” show how often a given location will be impacted long before it becomes part of the intertidal zone. This is essential information for understanding when flood impacts will begin to emerge. The option for one flooding day per year is a good indicator of the flooding extent and depth during the most extreme “King Tide” annually for a given scenario year or amount of SLR.
In the case of flooding frequency, there are two important caveats to the information presented. First, the frequencies represent an average number of times per year (Thompson et al., 2021). Any particular year may have substantially more or less flooding depending on local climate variability (such as the El Niño, La Niña cycle) and year-to-year variability in the tides due to changes in the alignment of the Earth, Moon, and Sun. Second, the flooding frequencies are based on data from the Pago Pago tide gauge on Tutuila, which means the estimates may not perfectly represent local conditions outside the harbor or on other islands. However, this is the best source of information available, and we do not expect this to lead to significant inaccuracies in the estimates of flooding frequency.
Sea Level Rise Layers
High-Tide Flooding


Data source: University of Hawaiʻi Sea Level Center (UHSLC)
Scenarios
The high-tide flooding layers are produced using a passive flooding model, often referred to as a “bathtub” model. It provides an assessment of flooded areas according to a specific water level. These water levels are determined using projections from the U.S. Interagency Task Force (ITF) in combination with land subsidence projections modeled by Han et al. (2019). The projections are modeled following both scenarios and time. The five scenarios range from low to high depending on the amount of greenhouse gases emissions, while time is divided by decade from 2030 to 2100.
On top of these scenarios, it is possible to select different flooding events. We provide three simulated flooding events, occurring 50 days per year, 20 days per year, or 1 day per year.
Increments
One-foot increment layers are modeled using the passive flooding approach and are independent of any scenario. They should be used for planning purposes for a specific amount of sea level rise independent of time and scenario.
As with the above scenarios, it is possible to select three different flooding events on top of these increments, occurring 50 days per year, 20 days per year, or 1 day per year.
Data Access
Use the pull-down menus below to select which data layer to access, then click on the desired data access link.
Year: Scenario: Flood Days Per Year: 1-Ft Increment:
Suggested data citation: Baizeau, C. and P.R. Thompson. 2023, updated 2025. Sea Level Rise: American Samoa: High-Tide Flooding: 2100 High Scenario. Version 3.0. Distributed by the Pacific Islands Ocean Observing System (PacIOOS). http://pacioos.org/metadata/as_uhslc_all_slr_flood_2100_high_v3.html. Accessed [date].
Other Overlays
Vertical Land Motion

Data source: National Aeronautics and Space Administration (NASA) Goddard Space Flight Center (GSFC)
Land subsidence rates across Tutuila and Aunuʻu are drawn from recent work by Huang et al. (2022) showing that the average rate of subsidence on these islands is spatially variable and ranges from 6 to 9 mm/yr. The study analyzed all available radar data from the European Space Agency’s Sentinel-1 satellite, which covers Tutuila and Aunuʻu only, and derived an average subsidence rate for the 6-year period between September 2015 to December 2022. Data are available over areas where radar data was successfully used to retrieve unambiguous measurements.
Data access: Shapefile, GeoJSON, WMS, WFS, metadata
Suggested data citation: Huang, S.A., J.M. Sauber, and R. Ray. 2022. Vertical Land Motion – Tutuila and Aunuu, American Samoa. Distributed by the Pacific Islands Ocean Observing System (PacIOOS). http://pacioos.org/metadata/as_nasa_tutma_vlm.html.
Related publication: Huang, S.A., J.M. Sauber, and R. Ray. 2022. Mapping vertical land motion in challenging terrain: Six-year trends on Tutuila Island, American Samoa, with PS-InSAR, GPS, tide gauge, and satellite altimetry data. Geophysical Research Letters, 49, e2022GL101363. https://doi.org/10.1029/2022GL101363.
References
- Anderson, T.R., C.H. Fletcher, M.M. Barbee, B.M. Romine, S. Lemmo, and J.M.S. Delevaux. 2018. Modeling multiple sea level rise stresses reveals up to twice the land at risk compared to strictly passive flooding methods. Scientific Reports, 8, 14484. https://doi.org/10.1038/s41598-018-32658-x.
- Blewitt, G., W.C. Hammond, and C. Kreemer. 2018. Harnessing the GPS data explosion for interdisciplinary science. Eos, 99. https://doi.org/10.1029/2018EO104623.
- Caldwell, P.C., M.A. Merrifield, and P.R. Thompson. 2001. Sea level measured by tide gauges from global oceans as part of the Joint Archive for Sea Level (JASL) since 1846. NOAA National Centers for Environmental Information. Dataset. https://doi.org/10.7289/v5v40s7w.
- Cooper, H.M. and Q. Chen. 2013. Incorporating uncertainty of future sea-level rise estimates into vulnerability assessment: A case study in Kahului, Maui. Climatic Change 121, 635–647. https://doi.org/10.1007/s10584-013-0987-x.
- Copernicus. n.d. Global Ocean Gridded L 4 Sea Surface Heights And Derived Variables Reprocessed 1993 Ongoing. E.U. Copernicus Marine Service Information (CMEMS). Marine Data Store (MDS). https://doi.org/10.48670/moi-00148.
- Han, S.-C., J. Sauber, F. Pollitz, and R. Ray. 2019. Sea level rise in the Samoan Islands escalated by viscoelastic relaxation after the 2009 Samoa-Tonga earthquake. Journal of Geophysical Research: Solid Earth, 124, 4142–4156. https://doi.org/10.1029/2018JB017110.
- Hawaiʻi Climate Change Mitigation and Adaptation Commission. 2021. State of Hawaiʻi Sea Level Rise Viewer. Version 1.11. Prepared by the Pacific Islands Ocean Observing System (PacIOOS) for the University of Hawaiʻi Sea Grant College Program and the State of Hawaiʻi Department of Land and Natural Resources, Office of Conservation and Coastal Lands, with funding from National Oceanic and Atmospheric Administration Office for Coastal Management Award No. NA16NOS4730016 and under the State of Hawaiʻi Department of Land and Natural Resources Contract No. 64064. http://hawaiisealevelriseviewer.org. Accessed August 25, 2023.
- Huang, S.A., J.M. Sauber, and R. Ray. 2022. Mapping vertical land motion in challenging terrain: Six-year trends on Tutuila Island, American Samoa, with PS-InSAR, GPS, tide gauge, and satellite altimetry data. Geophysical Research Letters, 49, e2022GL101363. https://doi.org/10.1029/2022GL101363.
- Nerem, R.S., T. Frederikse, and B.D. Hamlington. 2022. Extrapolating empirical models of satellite-observed global mean sea level to estimate future sea level change. Earth’s Future, 10, e2021EF002290. https://doi.org/10.1029/2021EF002290.
- NOAA National Geodetic Survey (NGS). 2022. NOAA NGS Topobathy Lidar DEM of Ofu and Olosega, American Samoa. NOAA National Centers for Environmental Information (NCEI). https://www.fisheries.noaa.gov/inport/item/72129. Accessed April 9, 2024.
- NOAA National Geodetic Survey (NGS). 2022. NOAA NGS Topobathy Lidar DEM of Rose Atoll, American Samoa. NOAA National Centers for Environmental Information (NCEI). https://www.fisheries.noaa.gov/inport/item/72133. Accessed April 9, 2024.
- NOAA National Geodetic Survey (NGS). 2022. NOAA NGS Topobathy Lidar DEM of Swains Island, American Samoa. NOAA National Centers for Environmental Information (NCEI). https://www.fisheries.noaa.gov/inport/item/72139. Accessed April 9, 2024.
- NOAA National Geodetic Survey (NGS). 2022. NOAA NGS Topobathy Lidar DEM of Ta’u, American Samoa. NOAA National Centers for Environmental Information (NCEI). https://www.fisheries.noaa.gov/inport/item/72142. Accessed April 9, 2024.
- NOAA National Geodetic Survey (NGS). 2022. NOAA NGS Topobathy Lidar DEM of Tutuila, American Samoa. NOAA National Centers for Environmental Information (NCEI). https://www.fisheries.noaa.gov/inport/item/72145. Accessed April 9, 2024.
- NOAA Office for Coastal Management (OCM). 2017. Detailed method for mapping sea level rise inundation. https://coast.noaa.gov/data/digitalcoast/pdf/slr-inundation-methods.pdf.
- Sweet, W.V., B.D. Hamlington, R.E. Kopp, C.P. Weaver, P.L. Barnard, D. Bekaert, W. Brooks, M. Craghan, G. Dusek, T. Frederikse, G. Garner, A.S. Genz, J.P. Krasting, E. Larour, D. Marcy, J.J. Marra, J. Obeysekera, M. Osler, M. Pendleton, D. Roman, L. Schmied, W. Veatch, K.D. White, and C. Zuzak. 2022. Global and regional sea level rise scenarios for the United States: Updated mean projections and extreme water level probabilities along U.S. coastlines. NOAA Technical Report NOS 01. National Oceanic and Atmospheric Administration, National Ocean Service, Silver Spring, MD, 111 pp. https://oceanservice.noaa.gov/hazards/sealevelrise/noaa-nos-techrpt01-global-regional-SLR-scenarios-US.pdf.
- Thompson, P.R., M.J. Widlansky, B.D. Hamlington, M.A. Merrifield, J.J. Marra, G.T. Mitchum, and W. Sweet. 2021. Rapid increases and extreme months in projections of United States high-tide flooding. Nature Climate Change, 11, 584–590. https://doi.org/10.1038/s41558-021-01077-8.
Publication Date: September 26, 2023
Last Updated: August 4, 2025
Version: 3.00
Update History: