Projects : American Samoa Coral Reef Drivers
Overview
Understanding the spatial distribution, intensity, overlap, and cumulative impact of human activities and environmental stressors is essential for effective management and protection of ecosystem services generated by coral reefs. Currently, this kind of information was not readily available or easily accessible to resource managers and policy makers in American Samoa.
This eco-geospatial tool gathers, organizes, analyzes, models, and visualizes spatially-explicit information for American Samoa. Hereby, GIS layers are developed to provide the spatial patterns of anthropogenic and environmental drivers that influence the status of coral reefs in the region and the potential for degradation, including:
- satellite-based oceanography:
- sea surface temperature (SST)
- chlorophyll-a
- photosynthetically active radiation (PAR)
- turbidity (Kd490)
- wave power
- coastal habitat modification
These geospatial products provide the basis to answer questions such as which places and habitat types are the most impacted; which stressors should be the greatest concern in different areas; and where to prioritize different management strategies. In addition, these datasets also inform watershed management and conservation action plans.
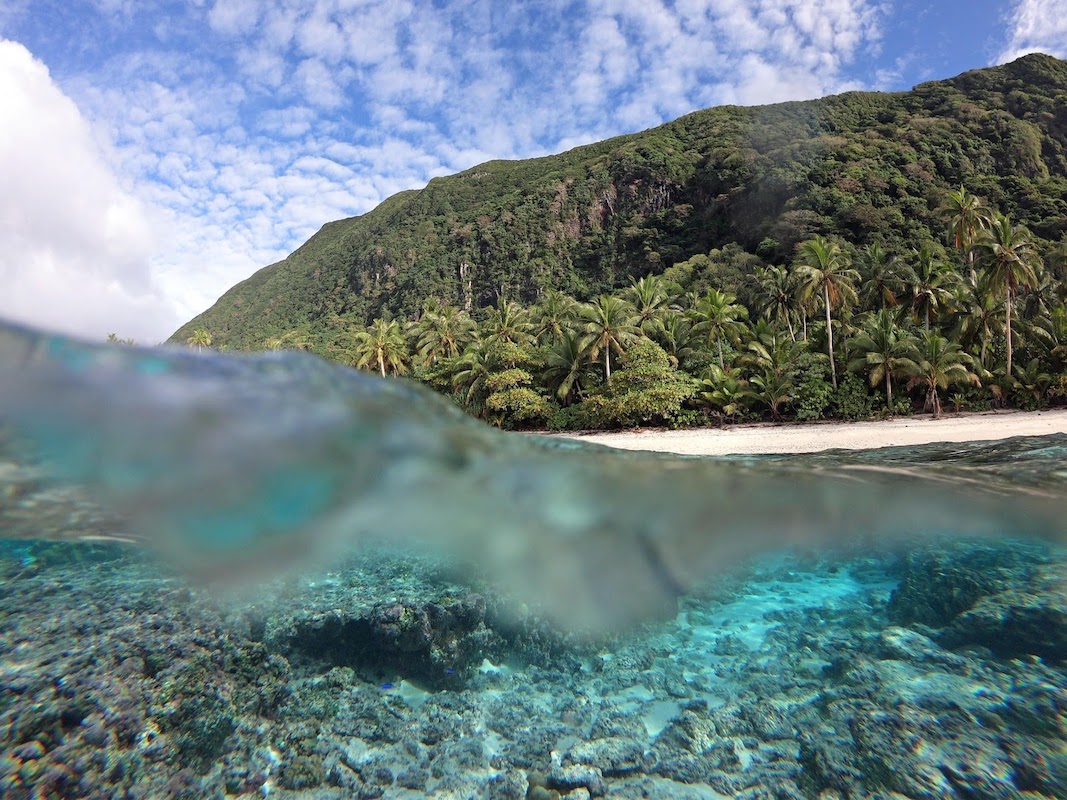
Figure 1. Over and under sea surface split image of shallow nearshore reef, Ofu and Olosega, American Samoa. Photo Credit: NOAA PIFSC.
See Also
For a similar project in Hawaiʻi, please visit:
For a project that used these data as input, please visit:
Publication Date: October 12, 2021
Last Updated: October 8, 2024
Version: 1.02
Update History:
Data
The data layers generated in this project provide the means to identify how environmental and anthropogenic drivers may influence the spatial patterns of coral reef ecosystems across American Samoa, and support management aimed at promoting reef resilience and the protection of ecosystem services.
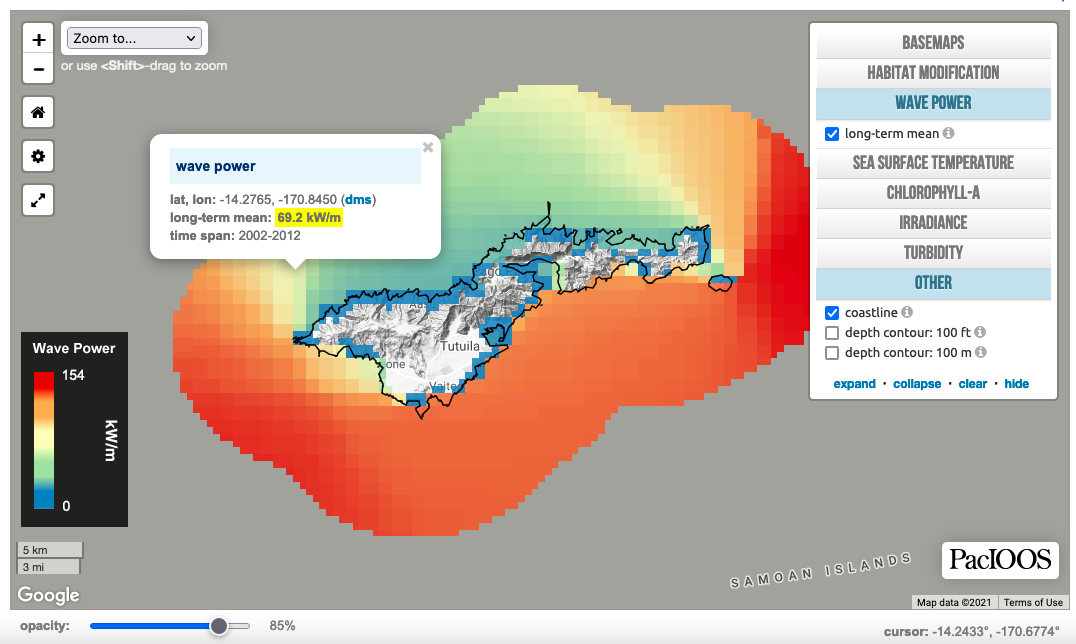
All data can be found in the map viewer, and are also available for download in various formats from the categories listed further below.
NOTE: This interactive mapping application is ill-suited for small screen sizes. Below is a screenshot only. Please visit again from a laptop or desktop computer to enable the application or make your browser window bigger.
Anthropogenic Drivers
Habitat Modification
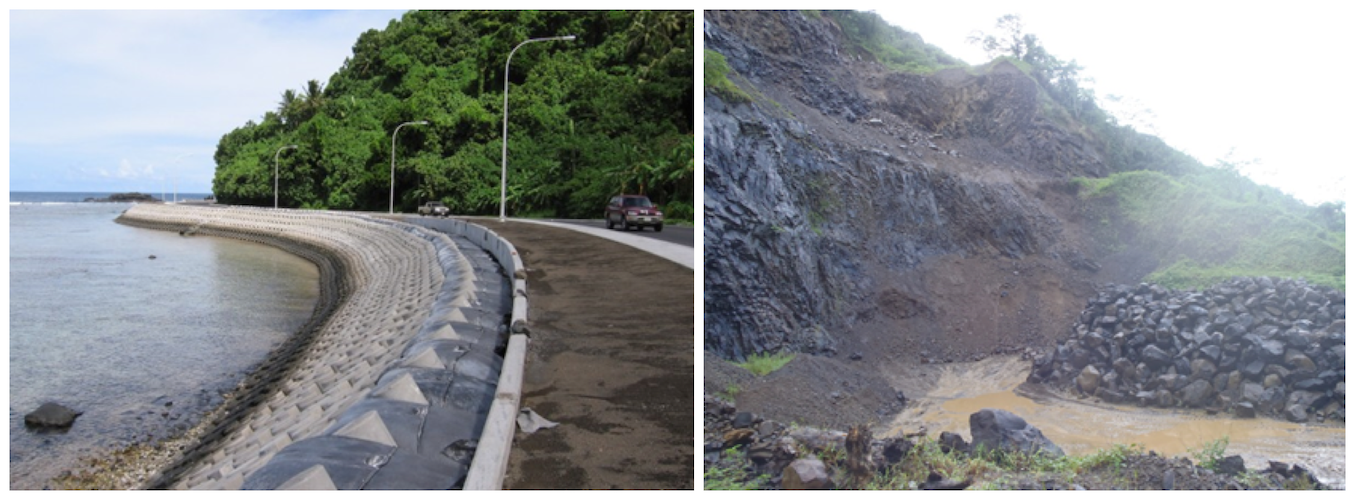
Figure 3. Left: Examples of coastal modification in American Samoa; coastal highway and concrete block seawall revetment. Photo Credit: NOAA PIFSC. Right: Samoa Maritime Rock Quarry. Photo Credit: Alex Messina.
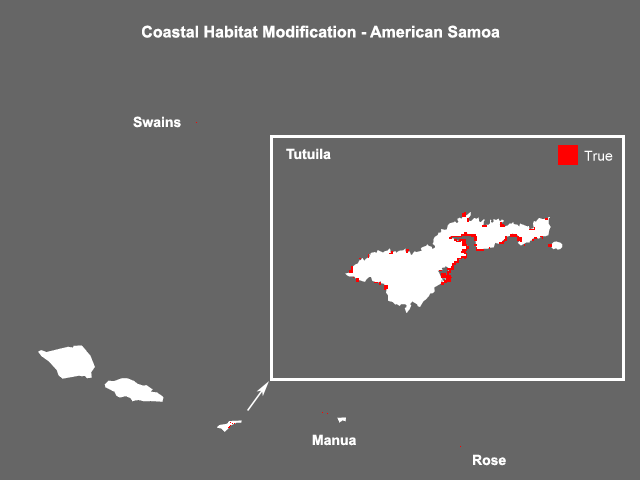
Coastal habitats are utilized and altered for a suite of human uses. Habitat modification is here defined as the alteration or removal of geomorphic structure resulting from human use. This includes several habitat-modifying features like seawalls, piers, breakwaters, dredged areas, artificial land (i.e., filled wetlands), and offshore structures. This data layer represents the presence of habitat modification in shallow waters of American Samoa. The presence of habitat-modifying features were mapped by combining several existing datasets derived primarily from satellite and aerial imagery. The layer represents the presence or absence of habitat modification, with a cell size of 250 m.
Relevant man-made features were extracted from each individual dataset and saved, including:
- features classified as artificial and dredged areas in NOAA benthic habitat maps;
- coastal segments designated as man-made structures and riprap in NOAA Environmental Sensitivity Index (ESI) line data.
The resulting polygon datasets were merged together; a field was added to all vector layers with a value of 1 for each feature to represent the presence of habitat modification. Vector data were subsequently converted to 250-m rasters and combined into a mosaic.
Environmental Drivers
Wave Power
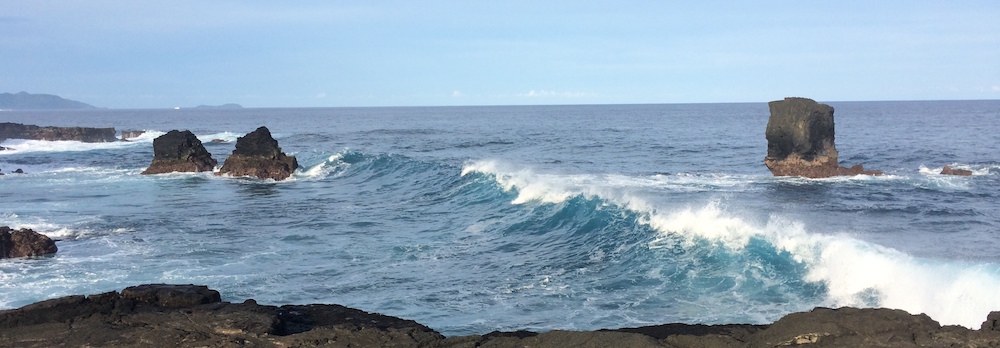
Figure 4. Waves along the southern shore of Tutuila, American Samoa. Photo Credit: PacIOOS.
Wave power is an important driving force of reef community development, structure, and persistence. In American Samoa, wave forcing shows weak seasonal variation superposed with episodic, cyclone-induced extreme wave events. Large wave heights typically occurred during winter months compared to smaller wave heights during the summer months.
In the absence of numerical wave model and wave forcing observational site-level data at the desired spatial resolution, a wave exposure proxy, developed by S. Jeanette Clark, is used to examine wave exposure. Wave energy estimates were derived at 1-km resolution utilizing NOAA WaveWatch III (WW3) global 0.5-deg wave model data and coastline analysis of wave exposure. This is achieved by:
- Determining the incident wave swath for a specific site at an island using a 360° radial plot and degree-bin elimination based on a swath’s intersection with land or relevant bathymetric contour.
- Selecting the closest WW3 pixel and extracting the time series for significant wave height, peak period, and peak direction.
-
Calculating wave power (kW/m) with significant wave height and peak period using the following equation:
Ef = ρg / 64π * Hs2 * Tp / 1000
where ρ is the density of sea water (1024 kg/m3), g is the acceleration of gravity (9.8 m/s2), Hs is the offshore significant wave height, and Tp is the dominant wave period (1/wavelength).
- Lastly, annual wave power data are filtered and organized into respective degree bins based on peak direction and summed to give a wave power estimate at each site. The wave power metric calculated here is based on offshore wave height and does not account for variation with depth.
Data source: https://polar.ncep.noaa.gov/waves/
Sea Surface Temperature
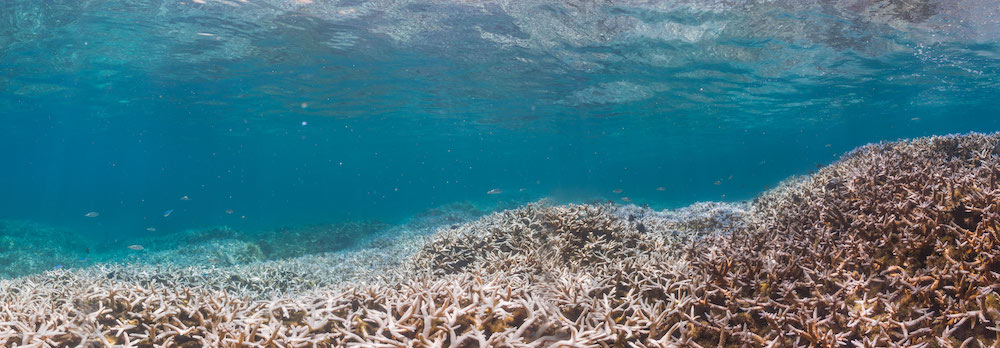
Figure 5. Coral Bleaching at Coconut Point, Tutuila. Photo Credit: XL Catlin Seaview Survey.
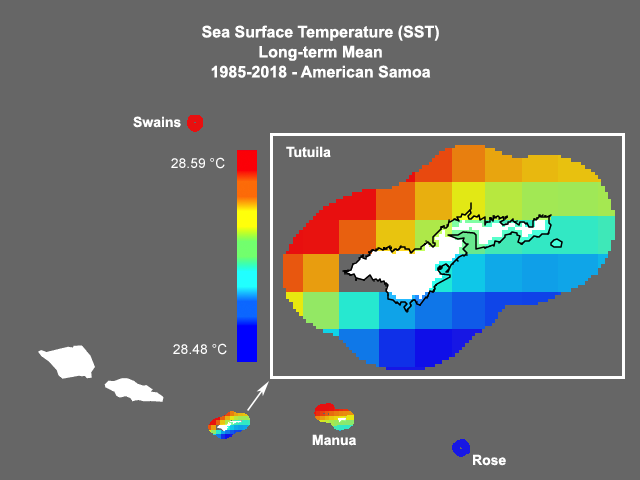
Most reef-building corals live at the upper range of their thermal tolerance. Global average atmospheric and sea surface temperatures have increased at unprecedented rates in the last few decades; and with rising sea temperatures, climate model projections suggest that coral bleaching-level heat stress will continue to increase, become more frequent, severe, and spatially widespread. Consequently, if bleaching events begin to occur annually in the coming decades, rates of disturbance may soon outpace the capacity of some important reef-building coral species to recover.
SST data (℃) were derived from CoralTemp 5-km gap-free analyzed blended sea surface temperature over the global ocean. CoralTemp is derived from three different but related 5-km daily gap-free SST data sets and provides an internally consistent SST product that stretches from 1985 to present:
- Operational Sea Surface Temperature and Sea Ice Analysis (OSTIA) Sea Surface Temperature Reanalysis (1985-2002)
- Geo-Polar Blended Night-Only Sea Surface Temperature Reanalysis (2002-2016)
- Geo-Polar Blended Night-Only Sea Surface Temperature Near Real-Time (2017 to present)
The 8-day composites are generated from daily Coral Reef Watch (CRW) files by OceanWatch Central Pacific.
Data source: https://oceanwatch.pifsc.noaa.gov/erddap/griddap/CRW_sst_v1_0_8day.graph
Sea Surface Temperature (SST) Maximum Monthly Climatological Mean, 1985-2018 – American Samoa
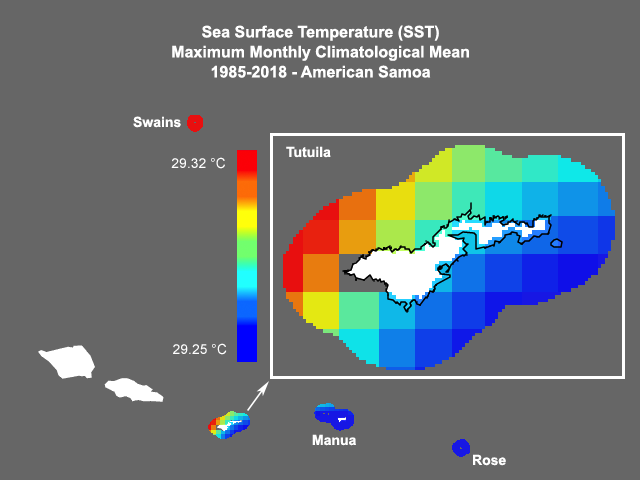
id: as_noaa_all_sst_clim_max
Sea Surface Temperature (SST) Average Annual Maximum Anomaly, 1985-2018 – American Samoa
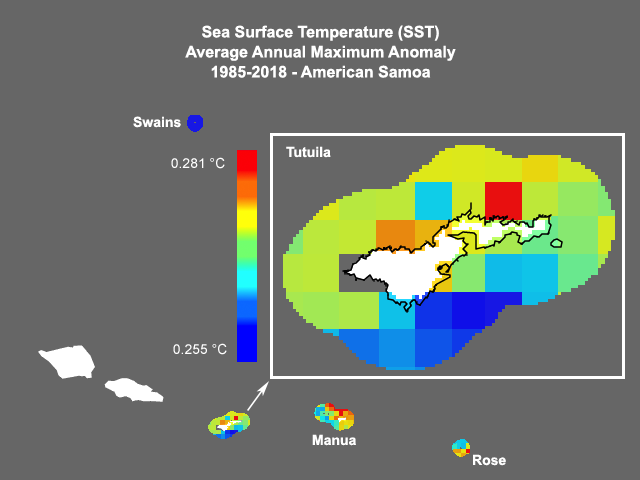
id: as_noaa_all_sst_anom_max
Sea Surface Temperature (SST) Average Annual Frequency of Anomalies, 1985-2018 – American Samoa
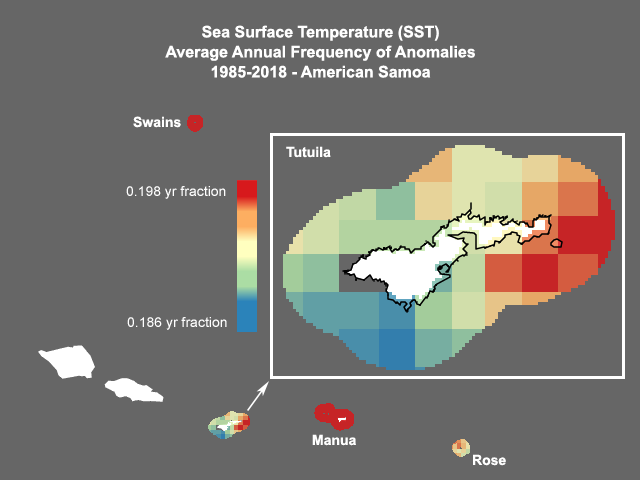
id: as_noaa_all_sst_anom_freq
Chlorophyll-a

Figure 6. Photo Credit: NASA.
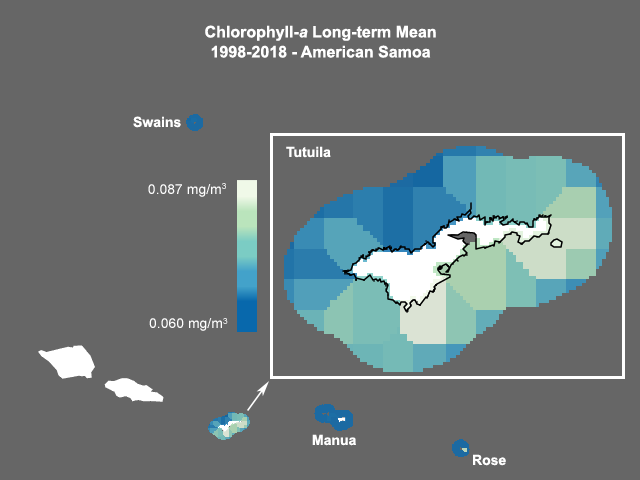
One often-used proxy of primary production is chlorophyll-a concentration; and there is a documented strong association correlation between chlorophyll-a and fisheries yield. Spatial chlorophyll-a variability mirrors the availability of inorganic nutrients, which in turn are determined by coastal and oceanographic processes including erosion and runoff, as well as turbulent mixing, upwelling, eddies, and internal tides.
Data for chlorophyll-a (mg/m3) were generated by the Ocean Colour component of the European Space Agency (ESA) Climate Change Initiative (CCI) project. These files are 8-day 4-km composites of merged sensor products, including:
- Global Area Coverage (GAC)
- Local Area Coverage (LAC)
- MEdium Resolution Imaging Spectrometer (MERIS)
- Moderate Resolution Imaging Spectroradiometer (MODIS) Aqua
- Ocean and Land Colour Instrument (OLCI)
- Sea-viewing Wide Field-of-view Sensor (SeaWiFS)
- Visible Infrared Imaging Radiometer Suite (VIIRS)
Data source: https://oceanwatch.pifsc.noaa.gov/erddap/griddap/esa-cci-chla-8d-v5-0.graph
Chlorophyll-a Maximum Monthly Climatological Mean, 1998-2018 – American Samoa
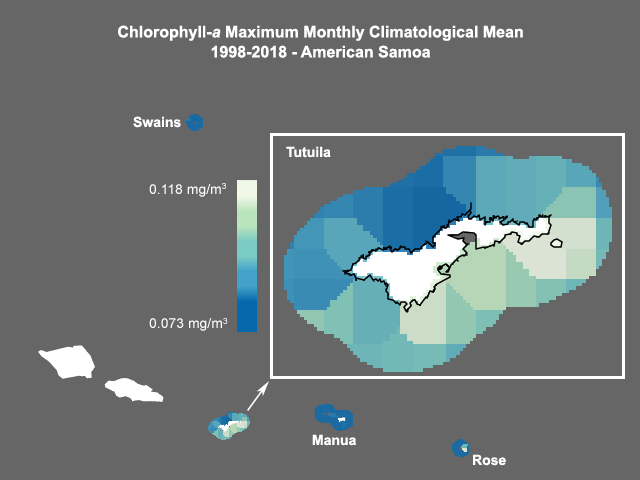
id: as_noaa_all_chlor_clim_max
Chlorophyll-a Average Annual Maximum Anomaly, 1998-2018 – American Samoa
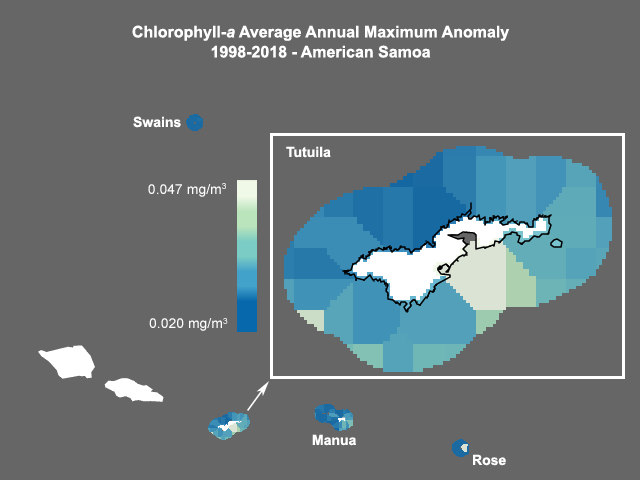
id: as_noaa_all_chlor_anom_max
Chlorophyll-a Average Annual Frequency of Anomalies, 1998-2018 – American Samoa

id: as_noaa_all_chlor_anom_freq
Irradiance

Figure 7. Photo Credit: Public Domain.
Photosynthetically active radiation (PAR) is a better measurement of light quantity than quality. Light is a key factor for the survival and physiology of corals that contain symbiotic zooxanthellae. Light intensity has a positive influence on coral growth and photosynthesis.
Although thermal stress is a principal cause of coral bleaching, it can perform synergistically with solar irradiance. Studies have demonstrated that high irradiance with elevated seawater temperatures led to bleaching of corals. In addition, more ultraviolet (UV) radiation penetration reportedly can cause more bleaching events. However, reduced light can also cause the bleaching.
Data for PAR (mol m-2 day-1) for the time period 2003‑2018 were obtained from the Moderate Resolution Imaging Spectroradiometer (MODIS) Aqua satellite instrument from the NASA OceanColor website as 8-day 4-km composites.
Data source: https://oceanwatch.pifsc.noaa.gov/erddap/griddap/aqua_par_8d_2018_0.graph
Photosynthetically Active Radiation (PAR) Maximum Monthly Climatological Mean, 2003-2018 – American Samoa
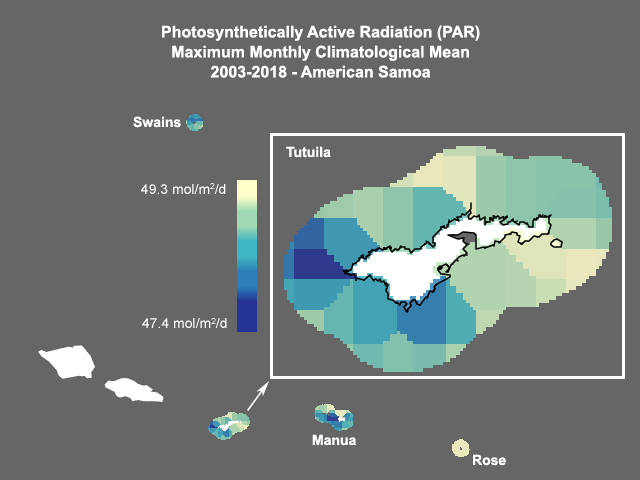
id: as_noaa_all_par_clim_max
Photosynthetically Active Radiation (PAR) Average Annual Maximum Anomaly, 2003-2018 – American Samoa
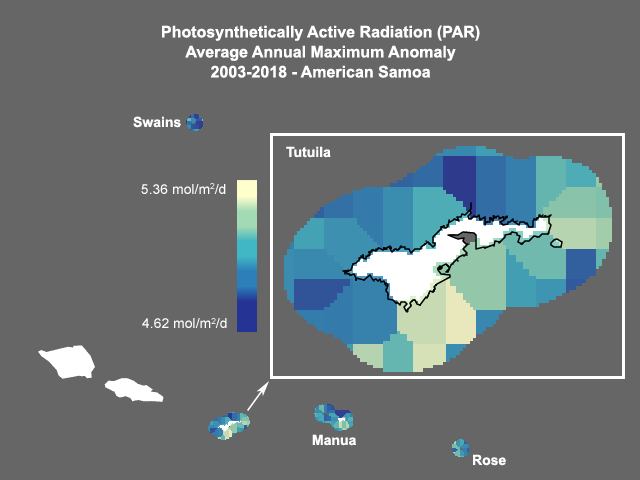
id: as_noaa_all_par_anom_max
Photosynthetically Active Radiation (PAR) Average Annual Frequency of Anomalies, 2003-2018 – American Samoa
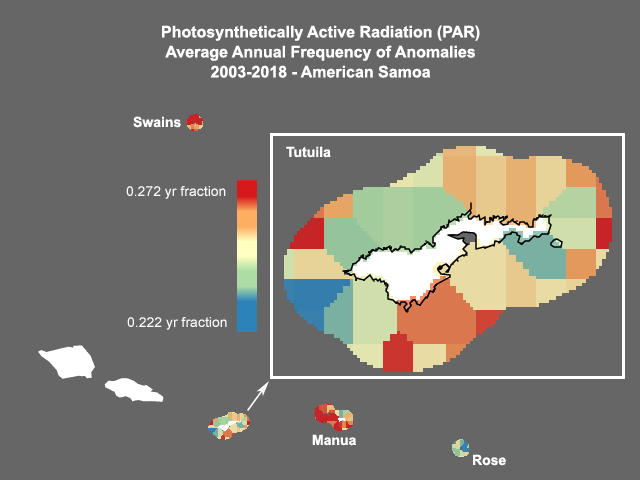
id: as_noaa_all_par_anom_freq
Photosynthetically Active Radiation (PAR) Long-term Mean, 2003-2018 – American Samoa
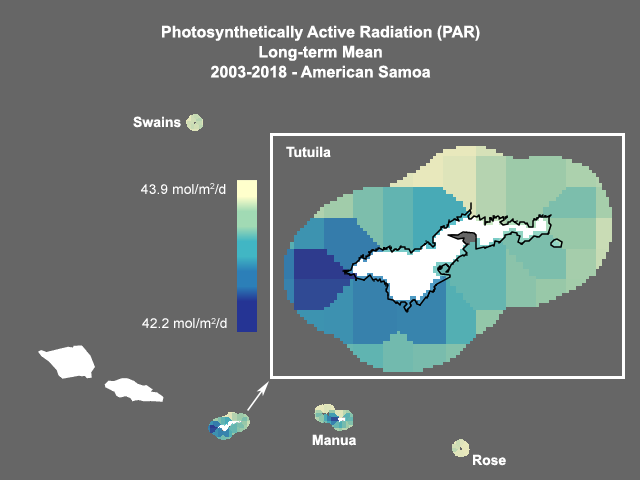
id: as_noaa_all_par_avg
Turbidity
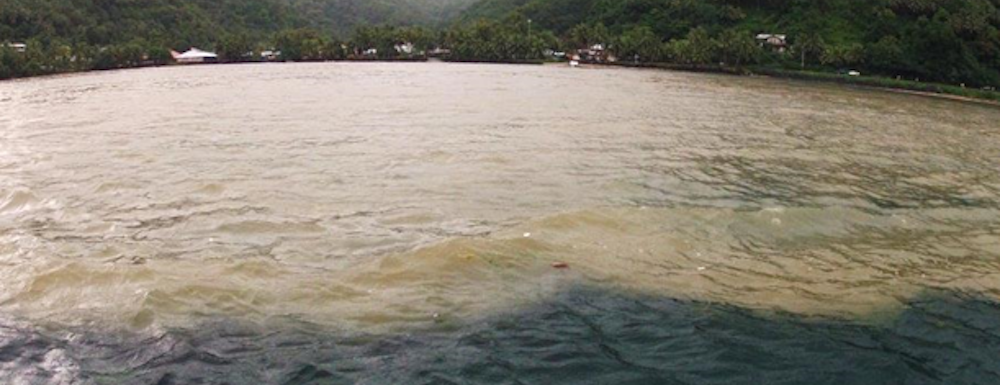
Figure 8. Sediment plume originating from runoff. Photo Credit: Alex Messina.
Spectrally-resolved ocean color is key to studying phytoplankton dynamics at seasonal and inter-annual scales, for a better understanding of the role of phytoplankton in marine biogeochemistry; the global carbon cycle; and the response of marine ecosystems to climate variability, change, and feedback processes. Ocean color data also have a critical role in operational observation systems monitoring coastal eutrophication, harmful algal blooms, and sediment plumes. The contiguous ocean color record reached 21 years in 2018. However, it is comprised of a number of one-off missions such that creating a consistent time series of ocean color data requires merging of the individual sensors without introducing artifacts.
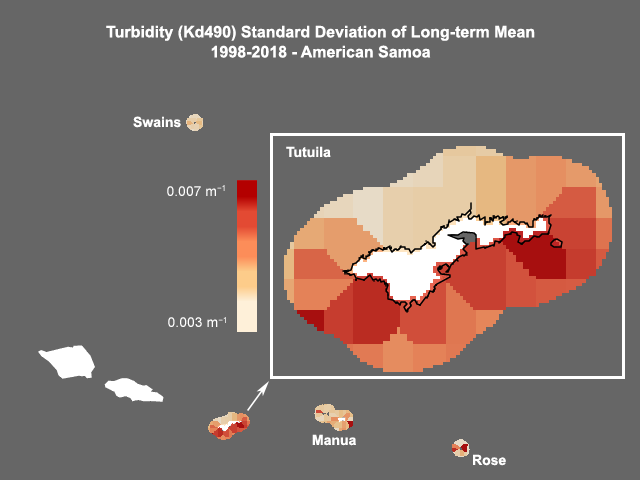
The diffuse attenuation coefficient at 490 nm (Kd490) indicates the turbidity of the water column—i.e., how well visible light in the blue to green region of the spectrum penetrates the water column. The value of Kd490 (m-1) represents the rate at which light at 490 nm is attenuated with depth. For example, a Kd490 of 0.1 per meter means that light intensity is reduced by one natural log within 10 meters of water. Thus, for a Kd490 of 0.1, one attenuation length is 10 meters. Higher Kd490 values mean shallower attenuation depths and thus higher turbidity, or lower clarity, of ocean water.
Data for Kd490 (m-1) were generated by the Ocean Colour component of the European Space Agency (ESA) Climate Change Initiative (CCI) project. These files are 8-day 4-km composites of merged sensor products, including:
- Global Area Coverage (GAC)
- Local Area Coverage (LAC)
- MEdium Resolution Imaging Spectrometer (MERIS)
- Moderate Resolution Imaging Spectroradiometer (MODIS) Aqua
- Ocean and Land Colour Instrument (OLCI)
- Sea-viewing Wide Field-of-view Sensor (SeaWiFS)
- Visible Infrared Imaging Radiometer Suite (VIIRS)
Data source: https://oceanwatch.pifsc.noaa.gov/erddap/griddap/esa-cci-kd-8d-v5-0.graph
Turbidity (Kd490) Maximum Monthly Climatological Mean, 1998-2018 – American Samoa
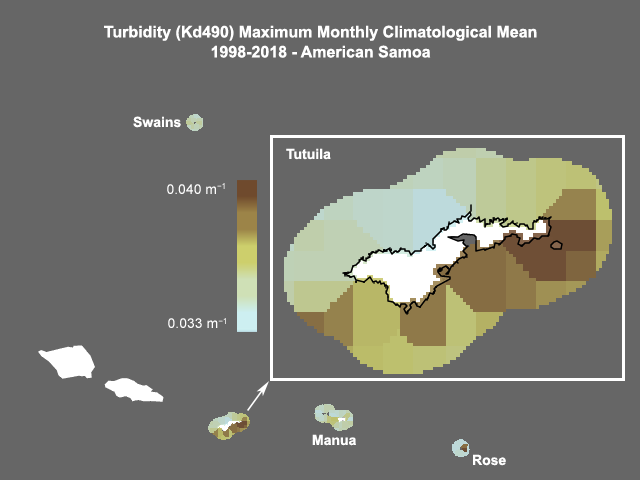
id: as_noaa_all_turb_clim_max
Turbidity (Kd490) Average Annual Maximum Anomaly, 1998-2018 – American Samoa
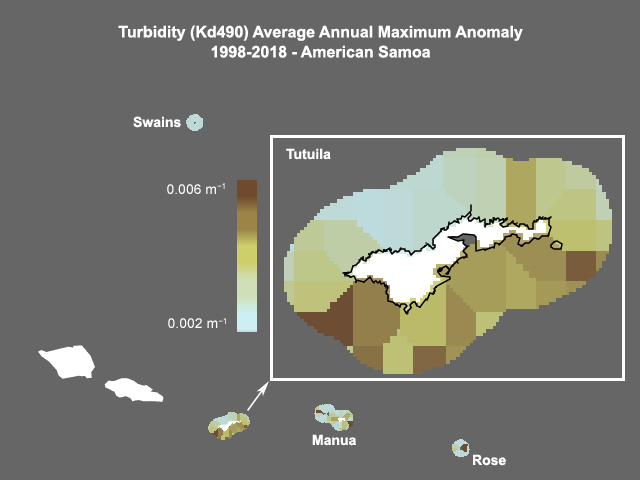
id: as_noaa_all_turb_anom_max
Turbidity (Kd490) Average Annual Frequency of Anomalies, 1998-2018 – American Samoa
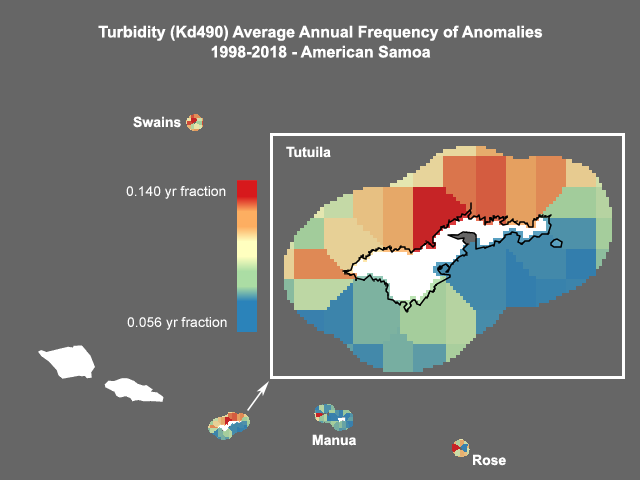
id: as_noaa_all_turb_anom_freq
Partners
 |
“The American Samoa Coral Reef Advisory Group is mandated to protect coral reef ecosystems and the people who depend on them. To do this, we need to understand why, when, and how coral reef conditions change. This tool synthesizes myriad datasets and variables that will help managers in the territory answer these questions and then make informed management decisions that will help corals thrive.” — Sabrina Woofter, American Samoa Coral Reef Advisory Group |
“The American Samoa Coral Reef Advisory Group is mandated to protect coral reef ecosystems and the people who depend on them. To do this, we need to understand why, when, and how coral reef conditions change. This tool synthesizes myriad datasets and variables that will help managers in the territory answer these questions and then make informed management decisions that will help corals thrive.” — Sabrina Woofter, American Samoa Coral Reef Advisory Group |
 |
“This tool will greatly assist our programs and American Samoa in marine resource management decisions.” — Domingo Ochavillo, American Samoa Department of Marine and Wildlife Resources |
“This tool will greatly assist our programs and American Samoa in marine resource management decisions.” — Domingo Ochavillo, American Samoa Department of Marine and Wildlife Resources |
This project was led by staff members of the National Oceanic Atmospheric Administration, Ecosystem Sciences Division, Pacific Islands Fisheries Science Center, Honolulu. Hawaiʻi. Partners included the American Samoa Division of Marine and Wildlife Resources and the American Samoa Coral Reef Advisory Group. This project was funded by NOAA’s Coral Reef Conservation Program, Grant #31248.
Data Sources
| Anthropogenic Drivers | Units | Temporal Range | Data Source |
|---|---|---|---|
| Habitat Modification | Presence of habitat-modifying features | 2001-2013 | NOAA CCMA Habitat Maps (2007); NOAA ESI lines (2001); Maintained channels (2013); Offshore aquaculture point locations |
| Environmental Drivers | Units | Temporal Range | Data Source |
| Wave Power | kW/m | 2002-2012 | NOAA WaveWatch-III (WW3) 0.1 degree global wave model (3-hourly) |
| Sea Surface Temperature | °C | 1985-2018 | NOAA Pathfinder, NOAA/NESDIS/STAR Blended SST 0.1 and 0.05 degree (weekly composites) |
| Chlorophyll-a | mg/m3 | 1998-2018 | ESA OC CCI blended (8-day composites) |
| Irradiance (PAR) | mol m-2 d-1 | 2003-2018 | MODIS (8-day composites) |
| Turbidity (Kd490) | m-1 | 1998-2018 | ESA OC CCI blended (8-day composites) |


