Nearshore Sensor Observations : Archive : Kewalo Basin, Oʻahu
This site has been decommissioned and is no longer collecting new data.
NOTE: Click on the plot below for data at a specific time.
NOTE: This instrument does not report in real-time. New data are retrieved periodically.
start date: : temperature: wave height: wind: rain: currents: site:
Disclaimer: Near real-time data have not been quality controlled.
Disclaimer: Data are released in compliance with real-time quality control standards.
Disclaimer: Real-time data are provided as raw and unaltered. Results of quality control checks are provided within the data set.
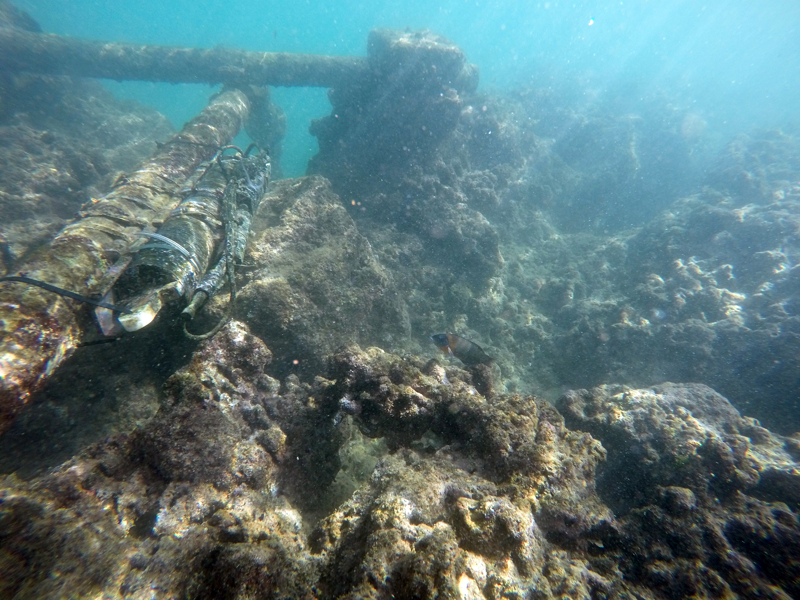
This nearshore sensor (nss_wqspp_004) operated between August 31, 2017 and May 2, 2019. It was located within the Kewalo Basin Harbor channel entrance approximately 85 meters from Point Panic just offshore of the Kewalo Marine Laboratory of the University of Hawaiʻi at Mānoa. Kewalo Basin is located along Oʻahu’s South Shore, situated between Kakaʻako Waterfront Park to its north and popular Ala Moana Beach Park to its south. The sensor package was mounted to the sea floor at approximately 1.5 meters depth. Data were recorded every 4 minutes.

Instrument site. Credit: PacIOOS/Gordon Walker.
The PacIOOS Water Quality Sensor Partnership Program (WQSPP) supports scientists and natural resource managers to collect water quality data in order to inform research, conservation, planning, and resource management projects in the U.S. Insular Pacific region. Comprised of a network of “roving” water quality nearshore sensors, the WQSPP provides participating partners with sensors, data management, and technical capacity-building to allow for robust data collection.
As part of the WQSPP, the Friends of Kewalos (FOK) signed a Memorandum of Understanding (MOU) to receive a PacIOOS nearshore sensor for a limited time. The non-profit organization, whose mission is to protect and preserve Kewalo Basin Park, have used the sensor to monitor water quality conditions before and during a construction project in Kewalo Basin Harbor. The Kewalo Basin Pier Repair-Improvement and Boat Slip Addition has the potential to stir up bottom sediments and alter the water quality conditions within the basin and the channel entrance. Such impacts could affect nearshore and offshore ocean users. Owned and maintained by PacIOOS under the supervision of Dr. Margaret McManus and lab.
Download a pdf summary sheet here
Data at a Glance
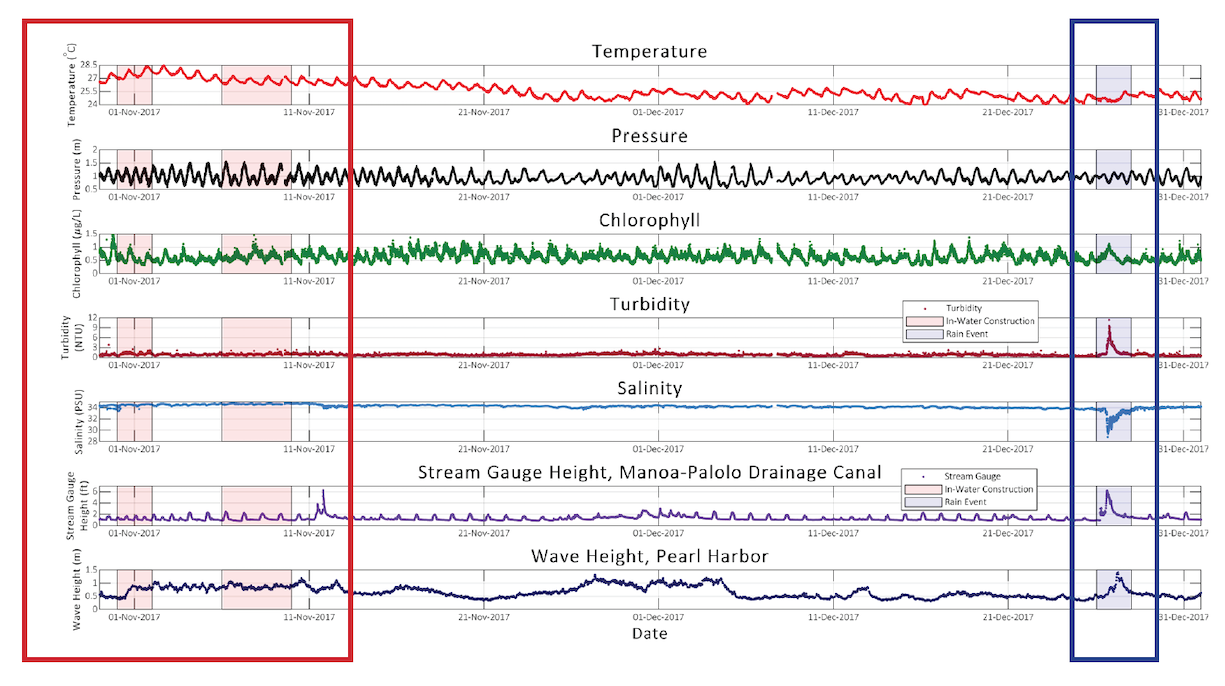
Data from this sensor package are used to characterize temporal variability in the water column properties at the mouth of Kewalo Basin. Deployment extended from September 2017 to May 2019, including a period of in-water construction to the Kewalo Basin Harbor in November 2017. Gaps in data are due to malfunctions with the sensor and a required servicing at Sea Bird Electronics.

Daily fluctuations in temperature (Celsius) are due to solar heating. Seasonal fluctuations in temperature are evident within the dataset. Temperature ranges from 22.24 °C to 29.27 °C with an average of 25.49 °C.
Pressure (meters) measures the water height above the sensor. Changes in pressure are due to Hawaiʻi’s mixed semidiurnal tide cycles (two highs and two lows per day). Pressure ranges from 0.33 m to 1.64 m, with an average of 0.92 m.
Chlorophyll (micro grams/liter) is a pigment found in phytoplankton, and is measured to monitor their presence. Fluctuations may be correlated with seasonal change and increased nutrient flux from surface water runoff. Chlorophyll ranges from 0.56 μg/L to 2.96 μg/L, with an average of 1.02 μg/L.
Turbidity (nephelometric turbidity units) shows the change in suspended particles in the water column from surface water runoff and shifts in daily tides. Turbidity ranges from 0.53 NTU to 24.73 NTU, with an average of 1.26 NTU.
Salinity (practical salinity units) fluctuates largely with freshwater input from land-based sources (e.g., stream and rain runoff). Salinity ranges from 28.81 PSU to 34.99 PSU, with an average of 34.46 PSU.
Stream gauge (United States Geological Survey) and wave height (PacIOOS) data are displayed to show correlations between the fluctuations seen in the above parameters. Rain events impacting stream gauge height show a relationship between the above parameters. Wave height does not appear to show any notable relationship.
Case Study
To get a better understanding of how each parameter is connected, we are taking a closer look at two separate events. The first case study focuses on “in-water work days” (highlighted in red) during the Kewalo Basin Harbor construction project from October 31 to November 2, and November 6-10, 2017. The second reviews a rain event (highlighted in blue) that occurred on December 26, 2017. By comparing each measured parameter, we are able to see how one additional change to the environment can actually affect many aspects of our nearshore waters.

In-water Construction
Friends of Kewalos and other community members were worried that this construction may have adverse effects to both the surrounding marine environment and to those who enjoy it. Findings from the nearshore sensor do not show any noticeable changes in the measured parameters over the course of each in-water construction period.
Rain Event
The average stream gauge height from December 26 to 28 was 2.50 ft, with a maximum level of 6.21 ft on the 26th. While this period does not show the greatest stream gauge height recorded over the duration of deployment, it does show increased levels accompanied with a dropping tide.
A dropping tide and decrease in pressure means less salt influx from offshore waters, offering a higher chance for freshwater input to drop the average level of salinity.
Salinity across this case study ranged from 28.81 PSU to 34.17 PSU, with an average of 33.18 PSU—which is lower than the average across the entire deployment. The largest drop in salinity over the duration of this study is documented on mid-day December 26,2017. This dip is correlated with increased rainfall and stream gauge height over the same time period.
Chlorophyll levels rise as runoff and likely nutrient levels increase and initiate algal growth. As these photosynthetic microorganisms multiply, so does the amount of chlorophyll pigment measured in the water. This case study shows a slight increase in chlorophyll over the course of this rain event.
Turbidity levels increase as more particulates become suspended in the water column and as different water masses are advected over the sensor. Rain events can increase the amount of sediment that streams bring to nearshore waters. The maximum turbidity level during this period was recorded at 11.64 NTU, one of the highest throughout the deployment.
Lastly, temperature was also affected by the influx of cooler, fresh water and the drop in salinity. The lowest temperature found during this rain event was 24.27 °C in the evening of December 26.
Conclusion
The parameters measured over the course of the partnership between Friends of Kewalos and the PacIOOS WQSPP are within normal and expected ranges and have been compared against the long-term PacIOOS nearshore sensors at the Hilton Hawaiian Village Atlantis Submarine Dock and the Hawaiʻi Yacht Club.
Friends of Kewalos would like to say mahalo to Howard Hughes and Sea Engineering for doing an excellent job on the Kewalo Basin renovation. As shown in PacIOOS’ data collection, the sediment debris was well contained during the chipping and piling work and the negative impacts (if any) to the nearshore waters were very minimal.


