Data Services : DChart
Dapper Chart (DChart)
![]()
 URL: http://oos.soest.hawaii.edu/dchart/
Developed by: NOAA Pacific Marine Environmental Laboratory (PMEL), DChart info
Summary:
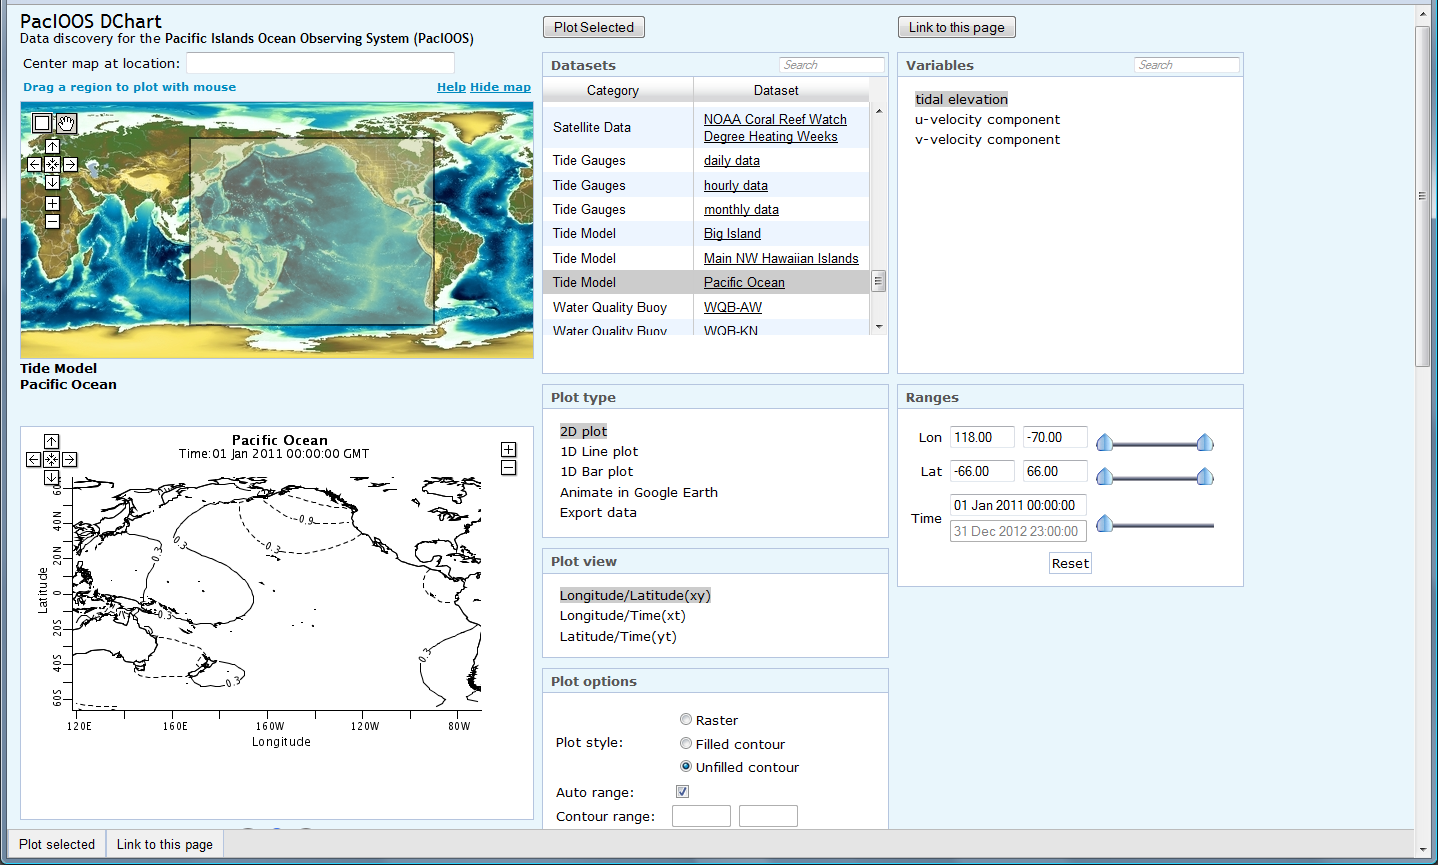
DChart’s strength lies in quickly producing interactive time series plots of point-based data sets, though it can also produce maps of gridded data. Point-based data are fed to DChart via an associated OPeNDAP server named Dapper.
Suggested use:
- Our most capable interface for producing plots of point-based time series, including our water quality buoys, nearshore sensors, and tide gauges.
Pros:
- Interactive plots and maps: show data value where mouse cursor hovers (plots only), draw a selection box to zoom, click to re-center.
- Select multiple stations to plot at once (up to five at a time).
- Our only interface for producing contour maps (filled or unfilled).
Cons:
- Limited data download capabilities and output formats.
- No RESTful (URL-based) data download mechanism. Tip: Though an OPeNDAP service is provided (via Dapper), we suggest that you use our primary TDS server for better metadata and other features.
- Buttons to bookmark the page are broken: cannot link back to your existing view.
- Map and plot styles are not very flexible: cannot modify colors, image size, or other options.
- Coastlines are coarse and no basemaps are provided, such as satellite imagery, Google-like maps, or other geographic aids.
- Cannot query data by clicking on a map.
- DChart is an orphaned project; no additional interface enhancements or bug fixes are anticipated.
Data offerings:
- Includes real-time in situ observations that are point-based (water quality buoys, nearshore sensors, tide gauges).
- Does not handle radials (high frequency radios) or trajectories (autonomous underwater vehicles).
- Provides most of our forecast models, one satellite data set, and other gridded data like bathymetry, though it cannot handle irregular (curvilinear) grids like our native ROMS ocean model.
- Links to one external data set not offered in our other servers: historical data from Argo profiling floats.
Screenshots:


Data types:
- grids
- points
Services:
- none
Output formats:
- NetCDF
- PNG
- KML
- ASCII text: comma-separated values (CSV) or tab-separated values (TSV)
- Java Ocean Atlas (JOA)
Metadata:
- not viewable within interface; packaged with downloaded data as attributes.
Viewers:
- makes maps, time series plots, transects, depth profiles, and scatter plots
- zoomable maps and plots
- mouse cursor shows nearest data value in plots
Additional features:
- View data in Google Earth or Google Maps.
- Produce animations of maps over time in DChart or Google Earth.